README
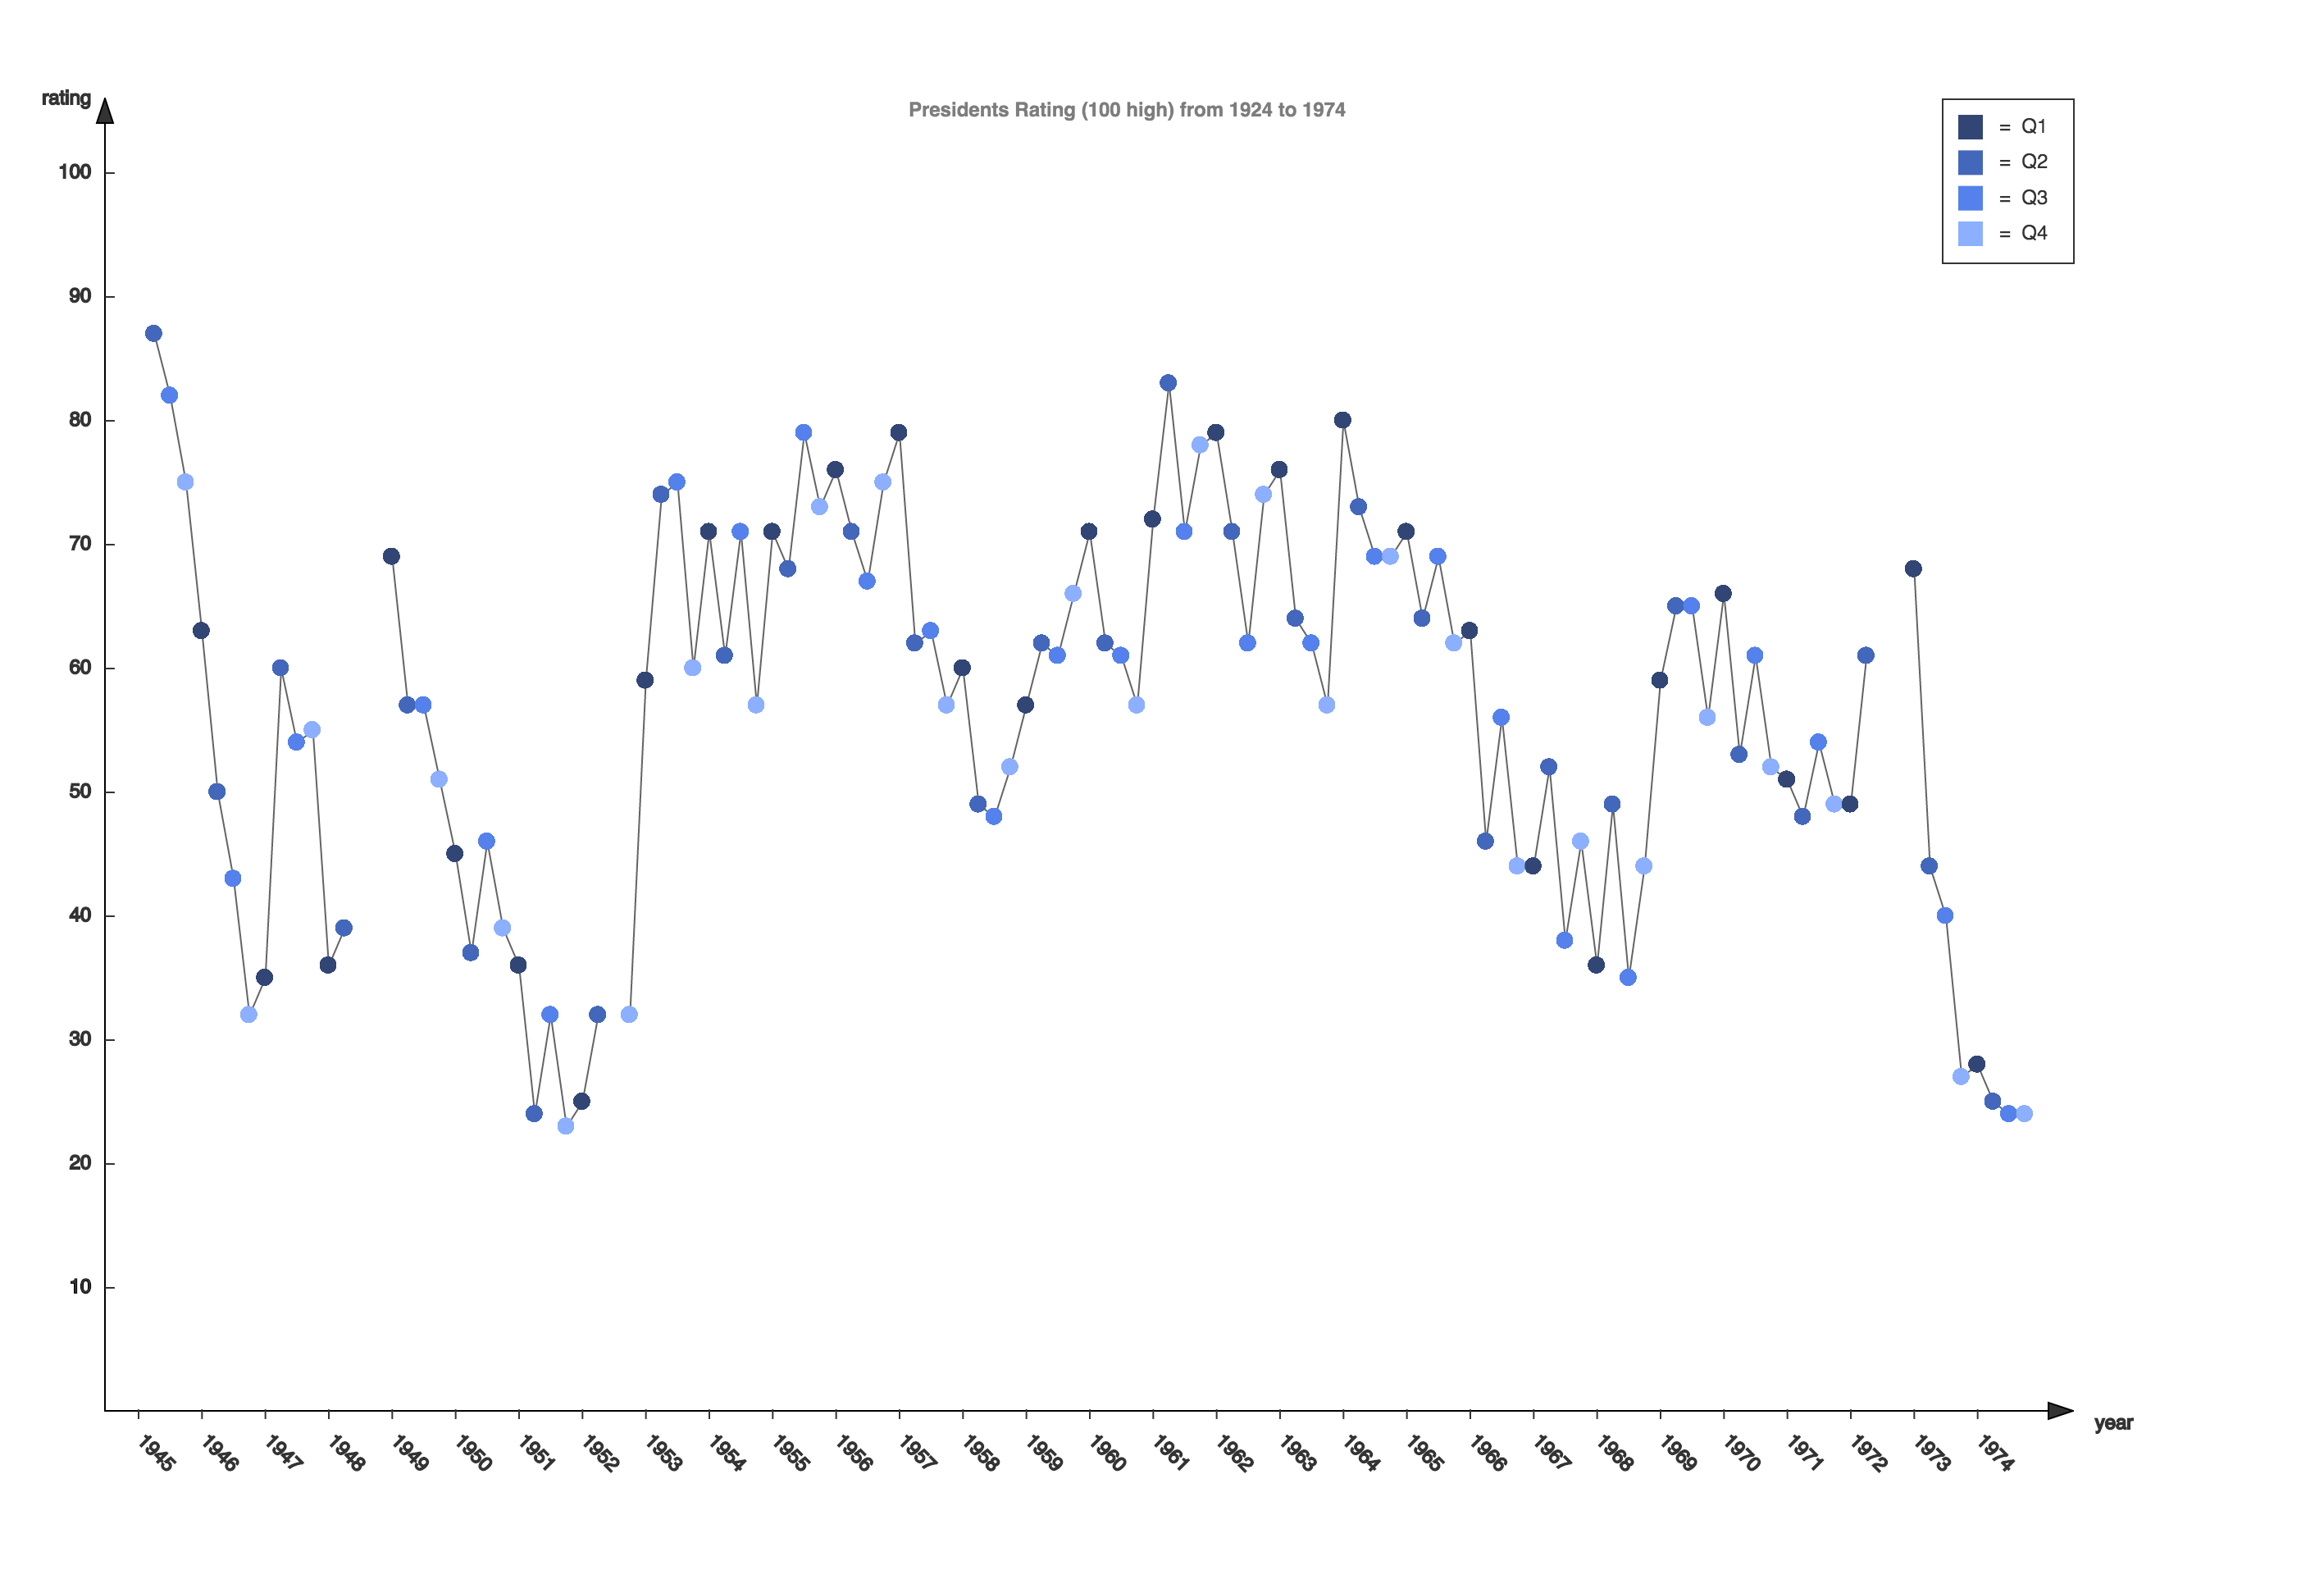
This is a small project to get familiar with P5.js. As mentioned, the only purpose of the code here is to display a specific dataset (U.S. Presidents rating from 1945 - 1974 in this case.).
Implemented features are as following:
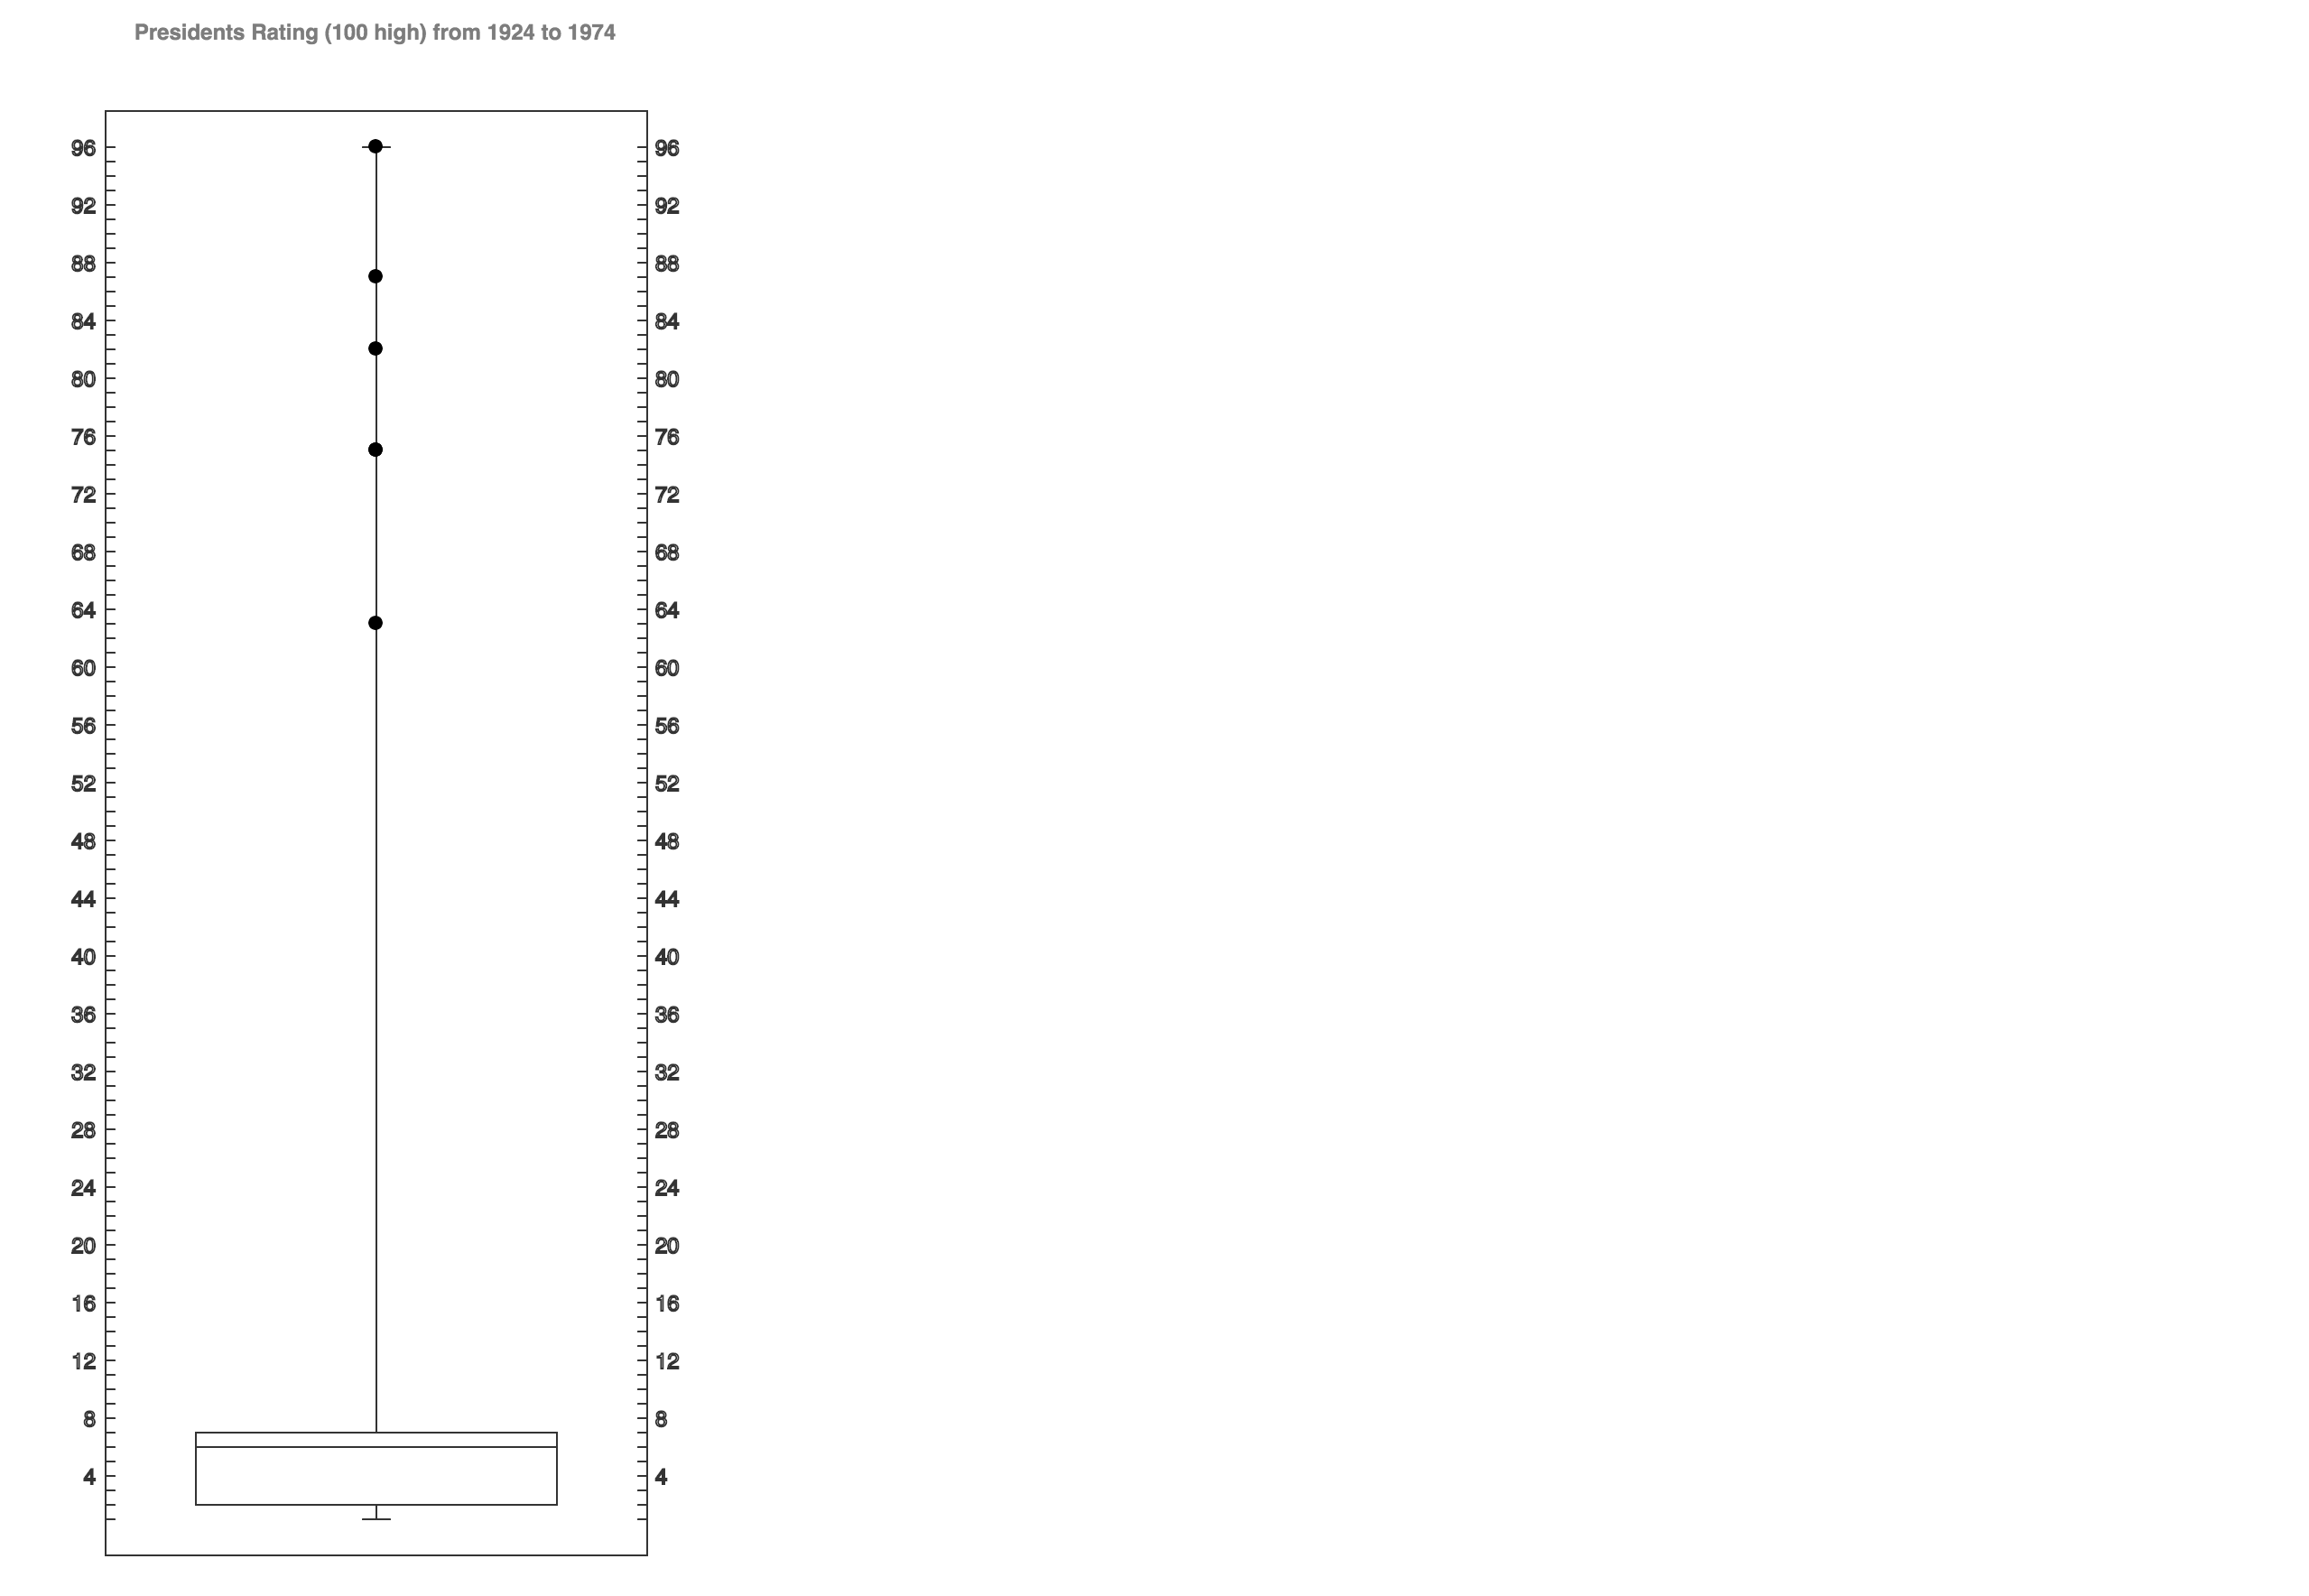
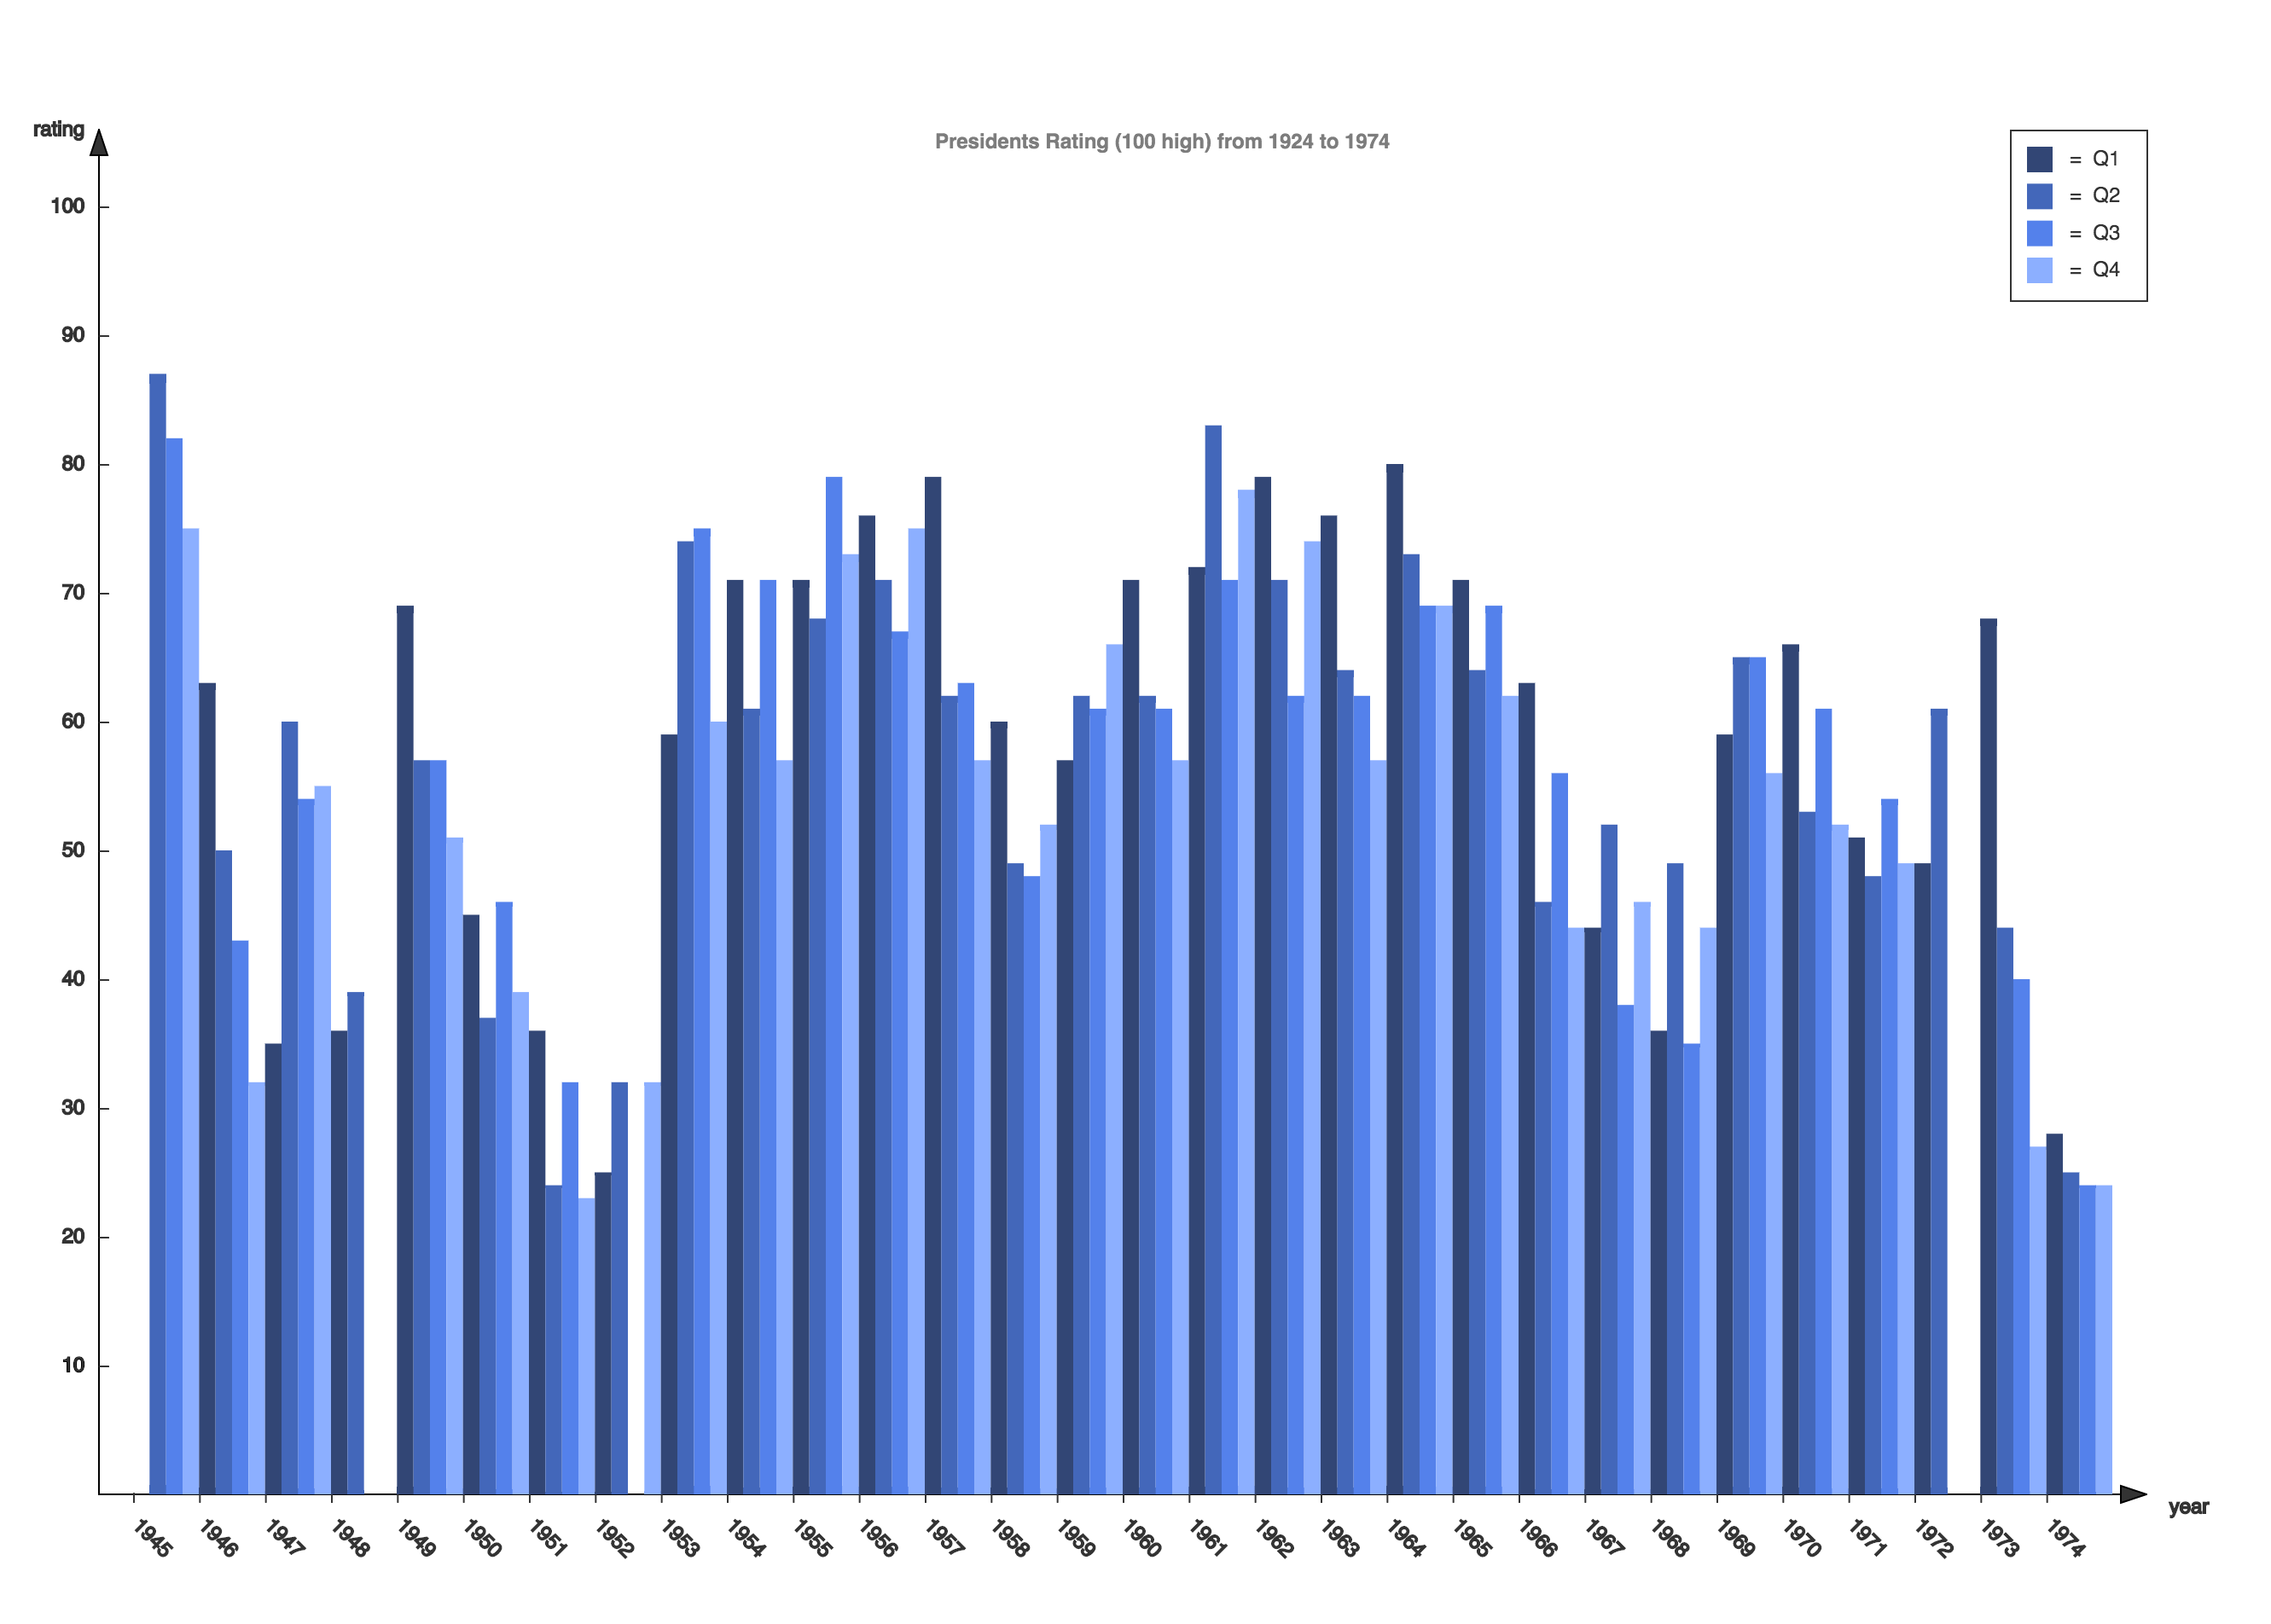
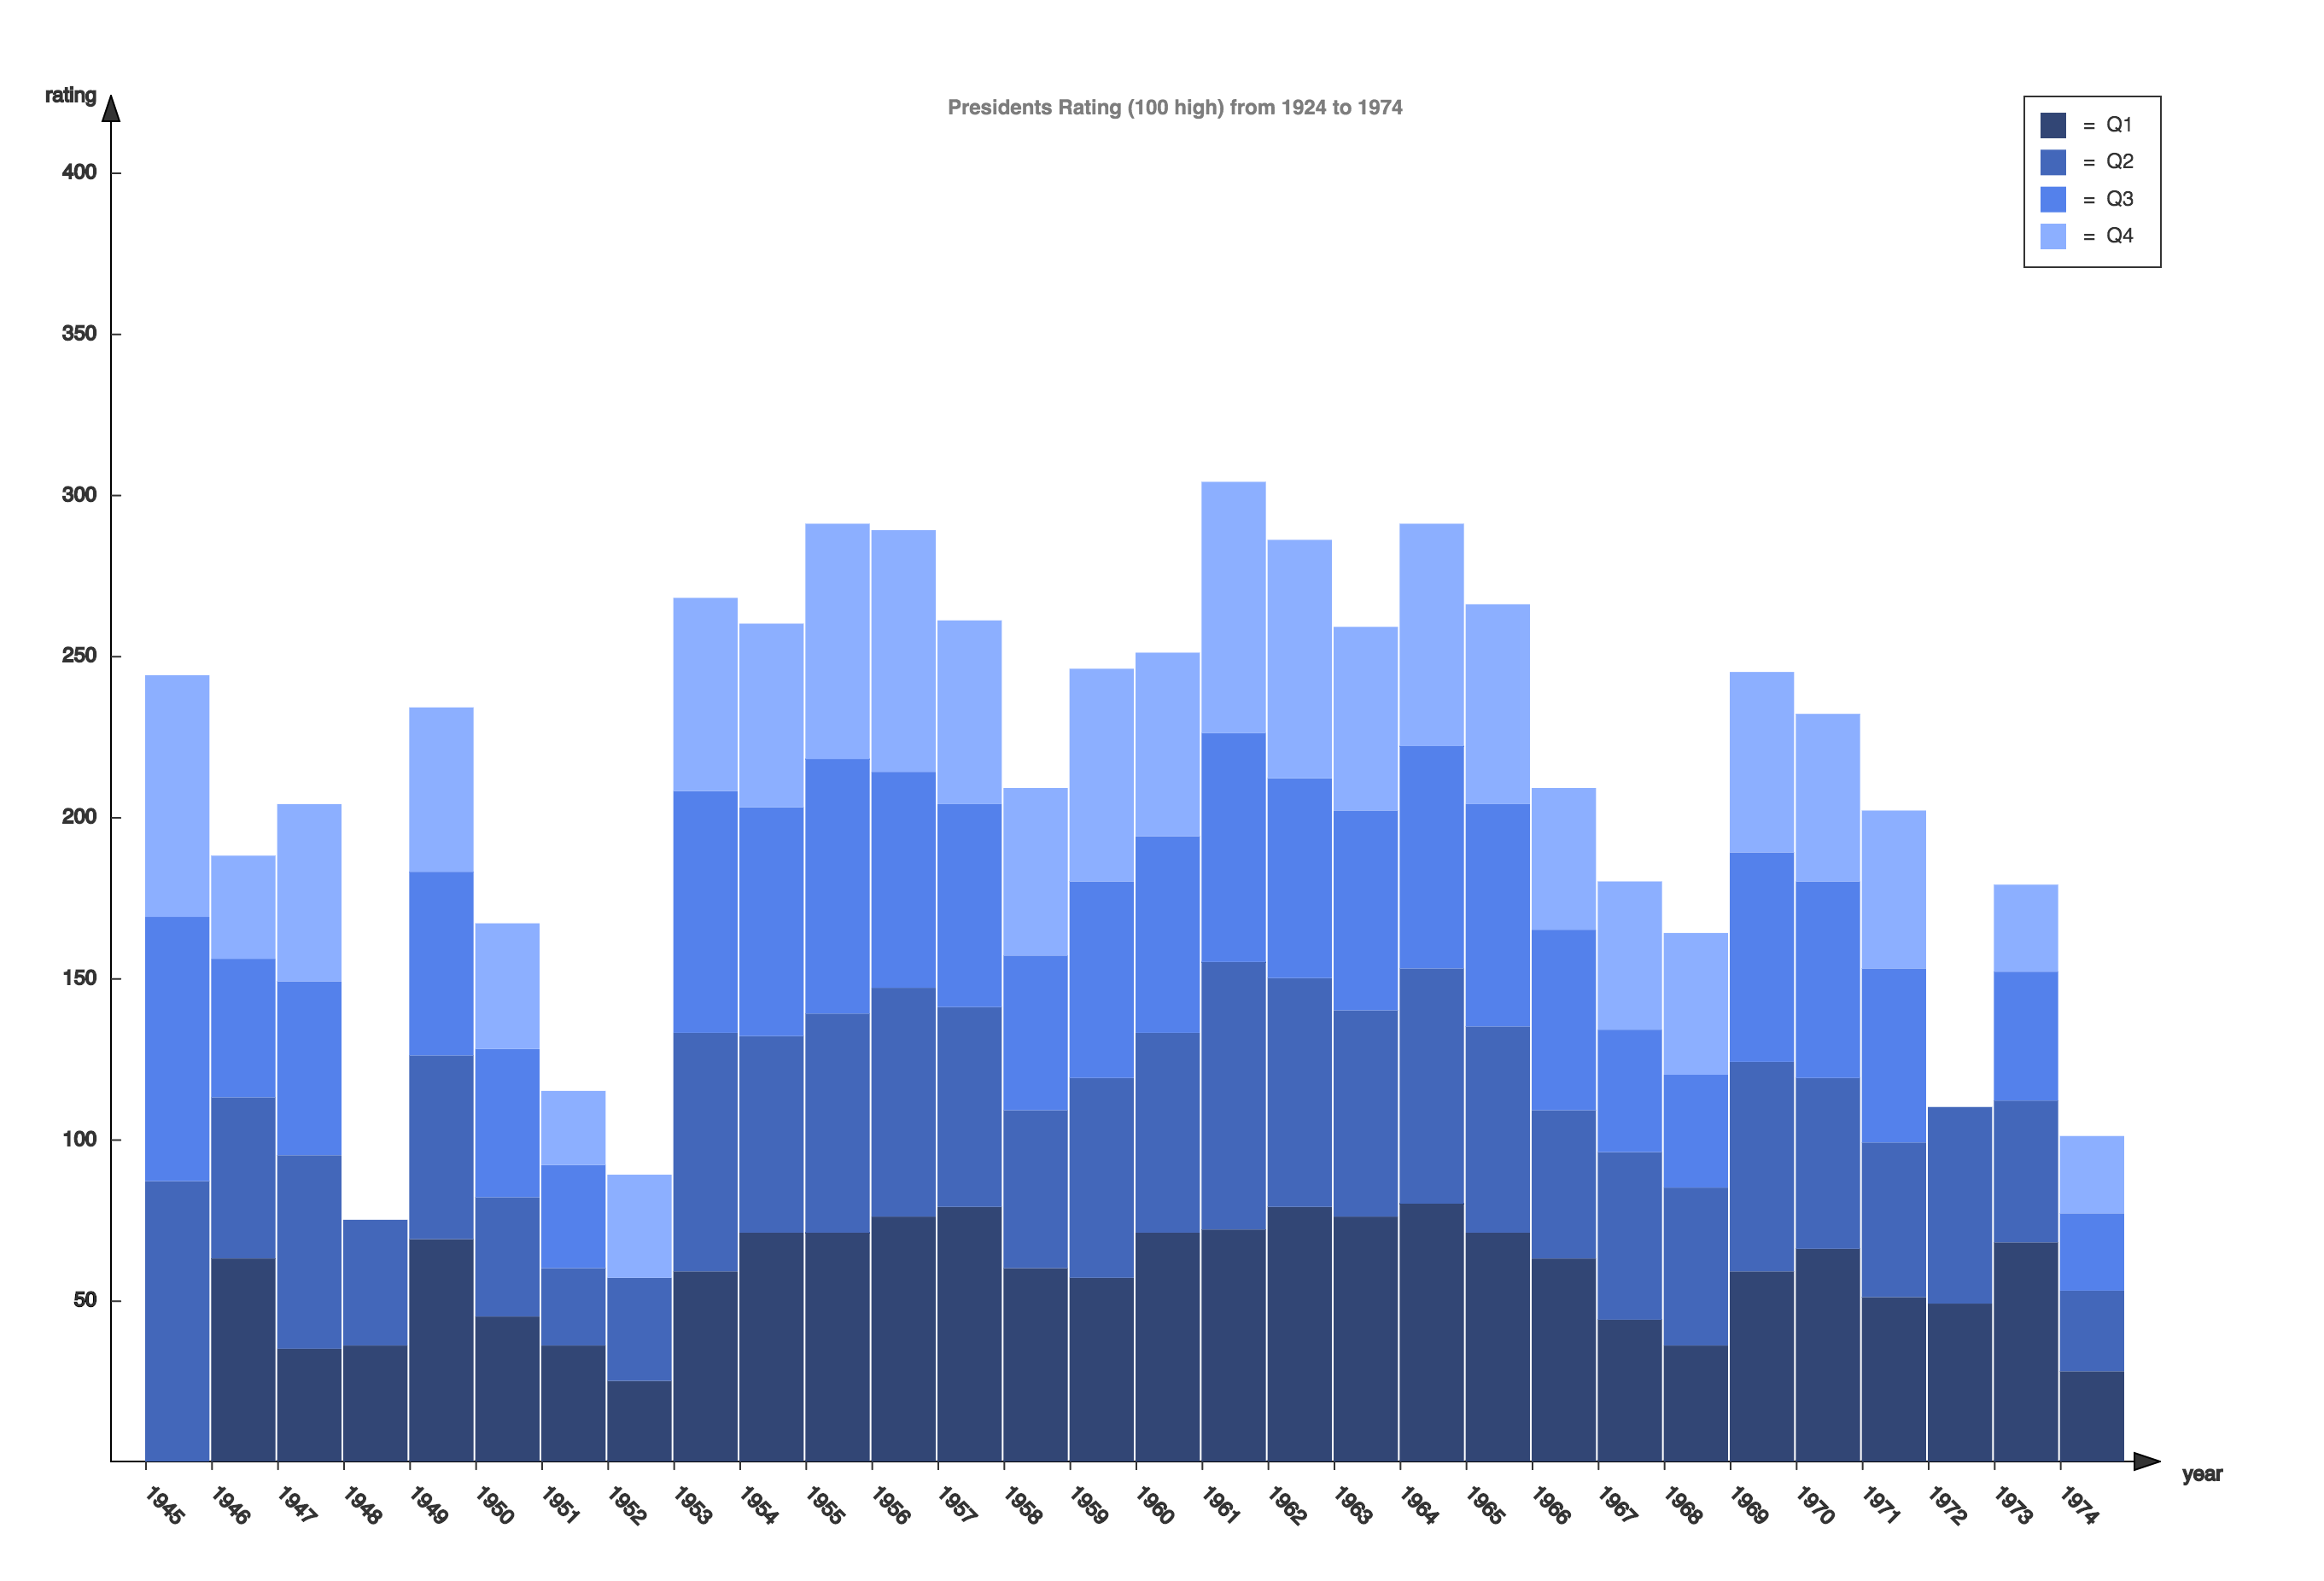
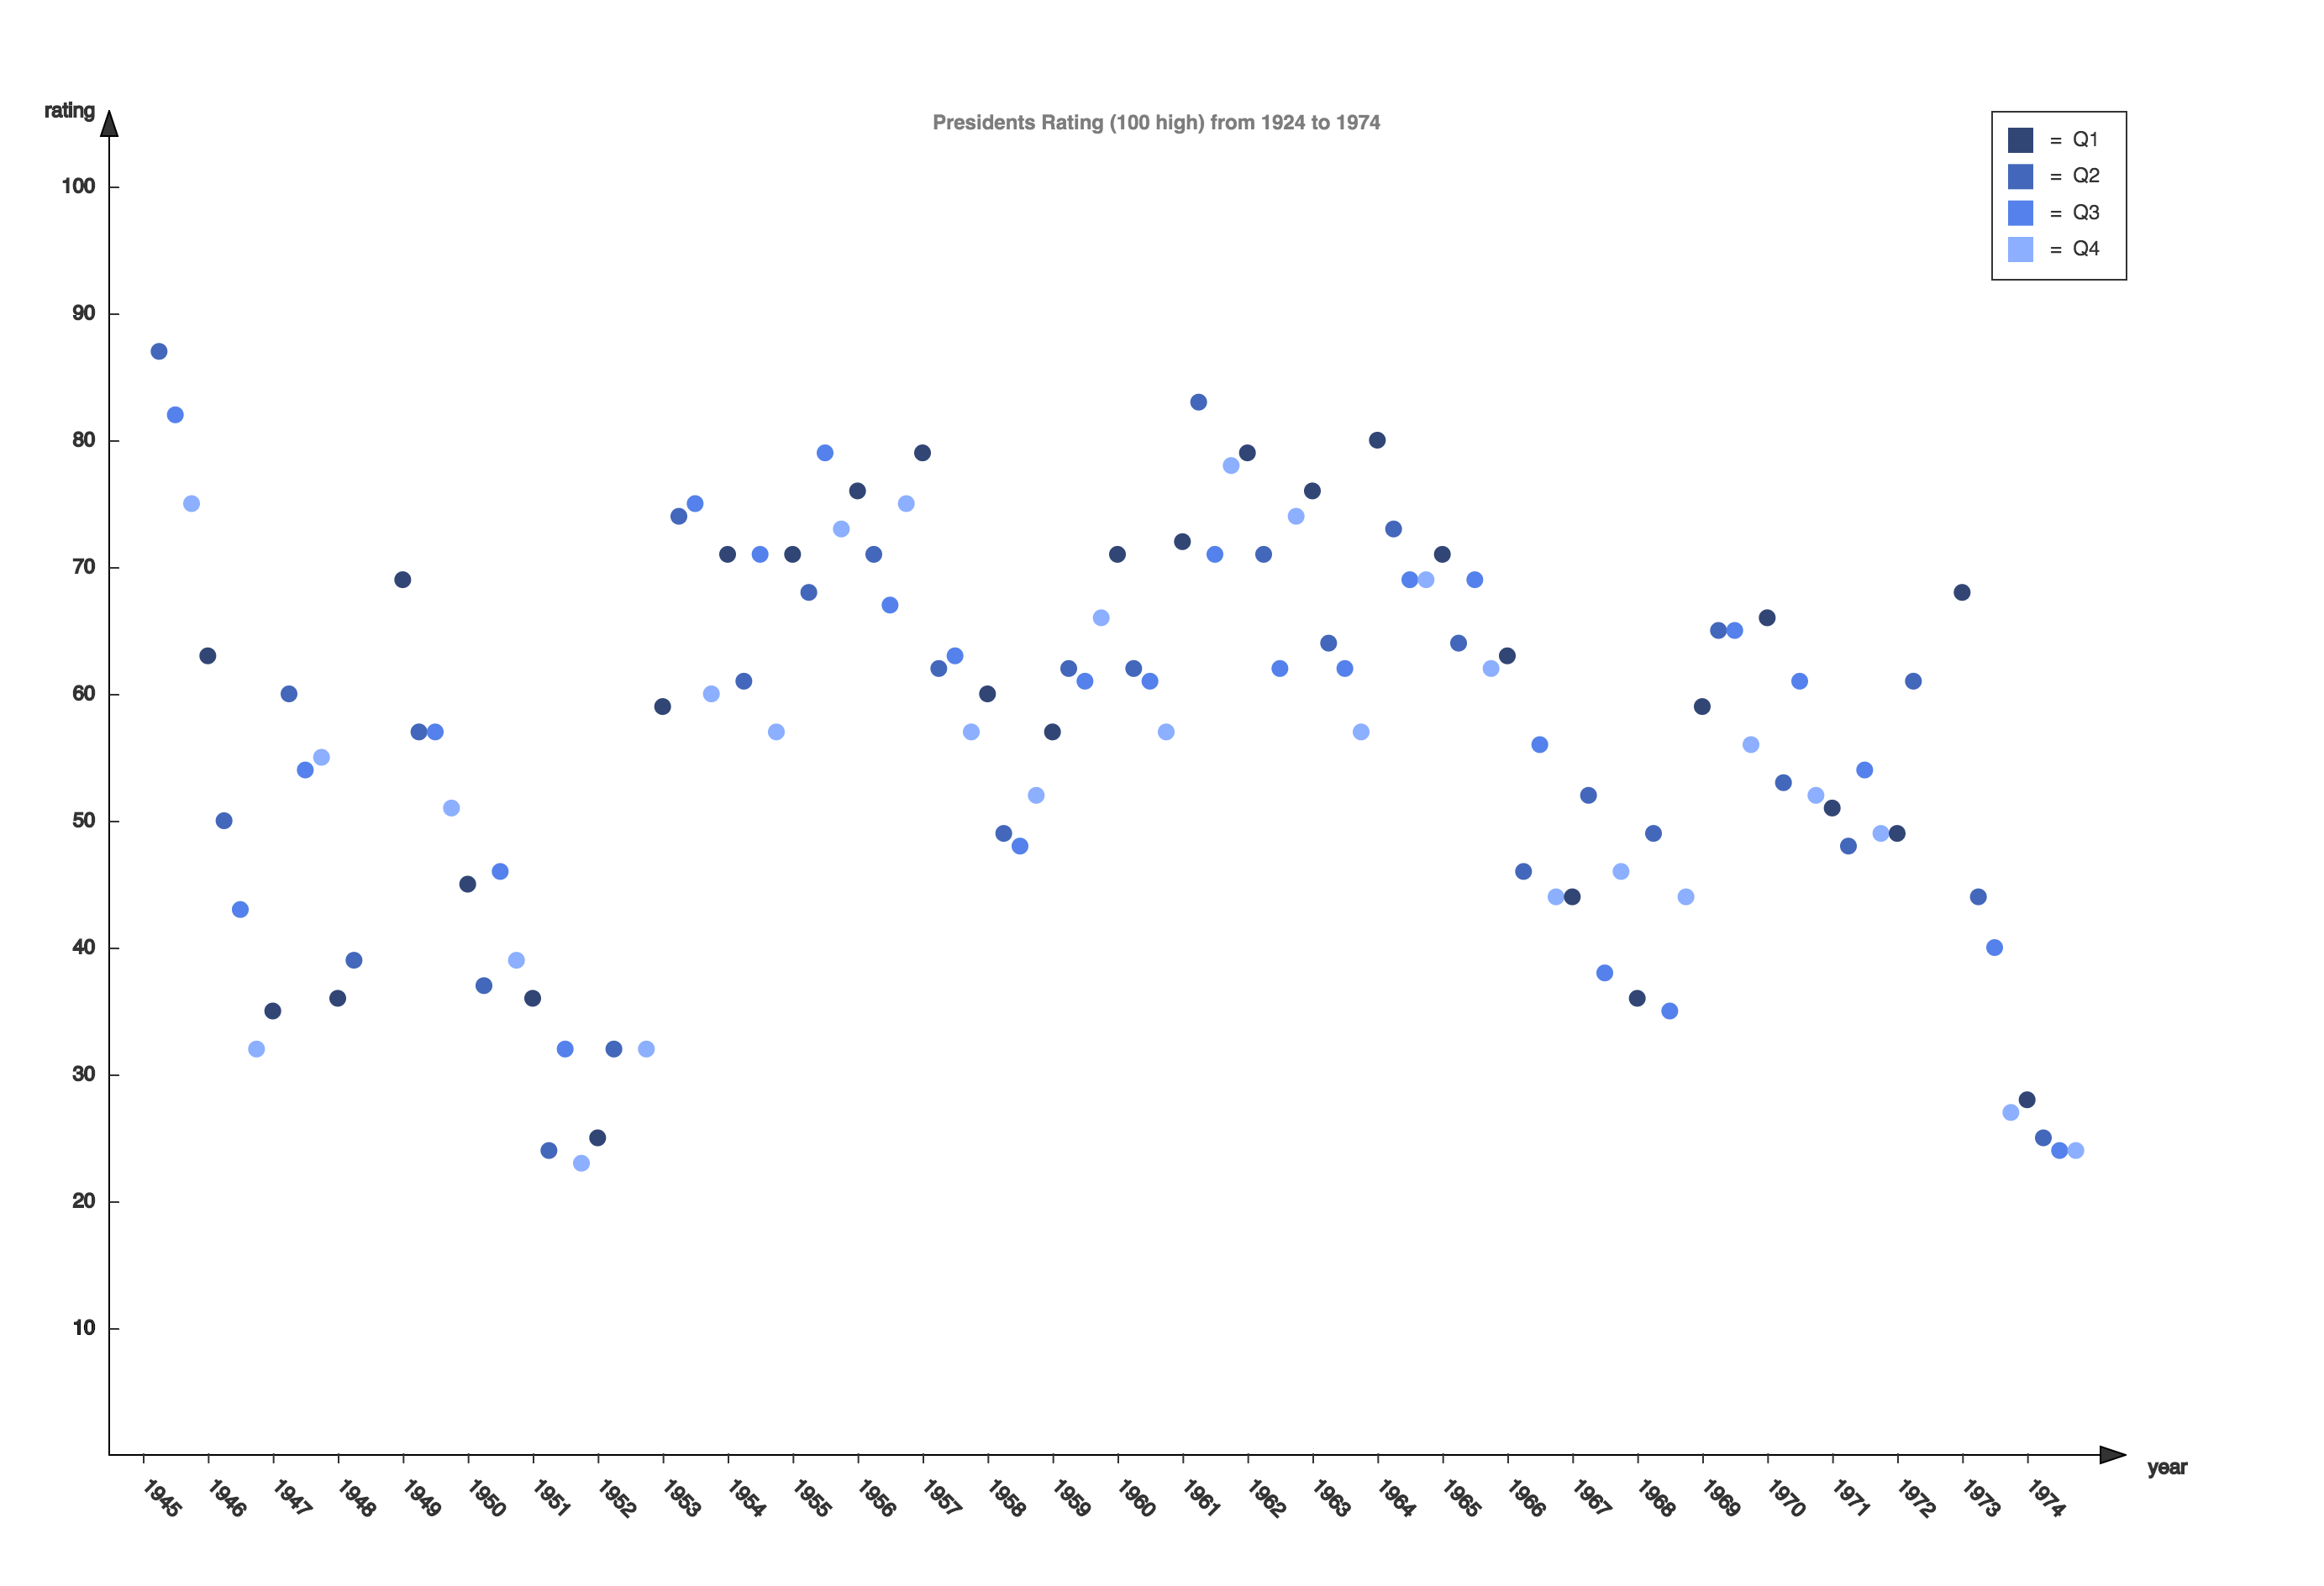
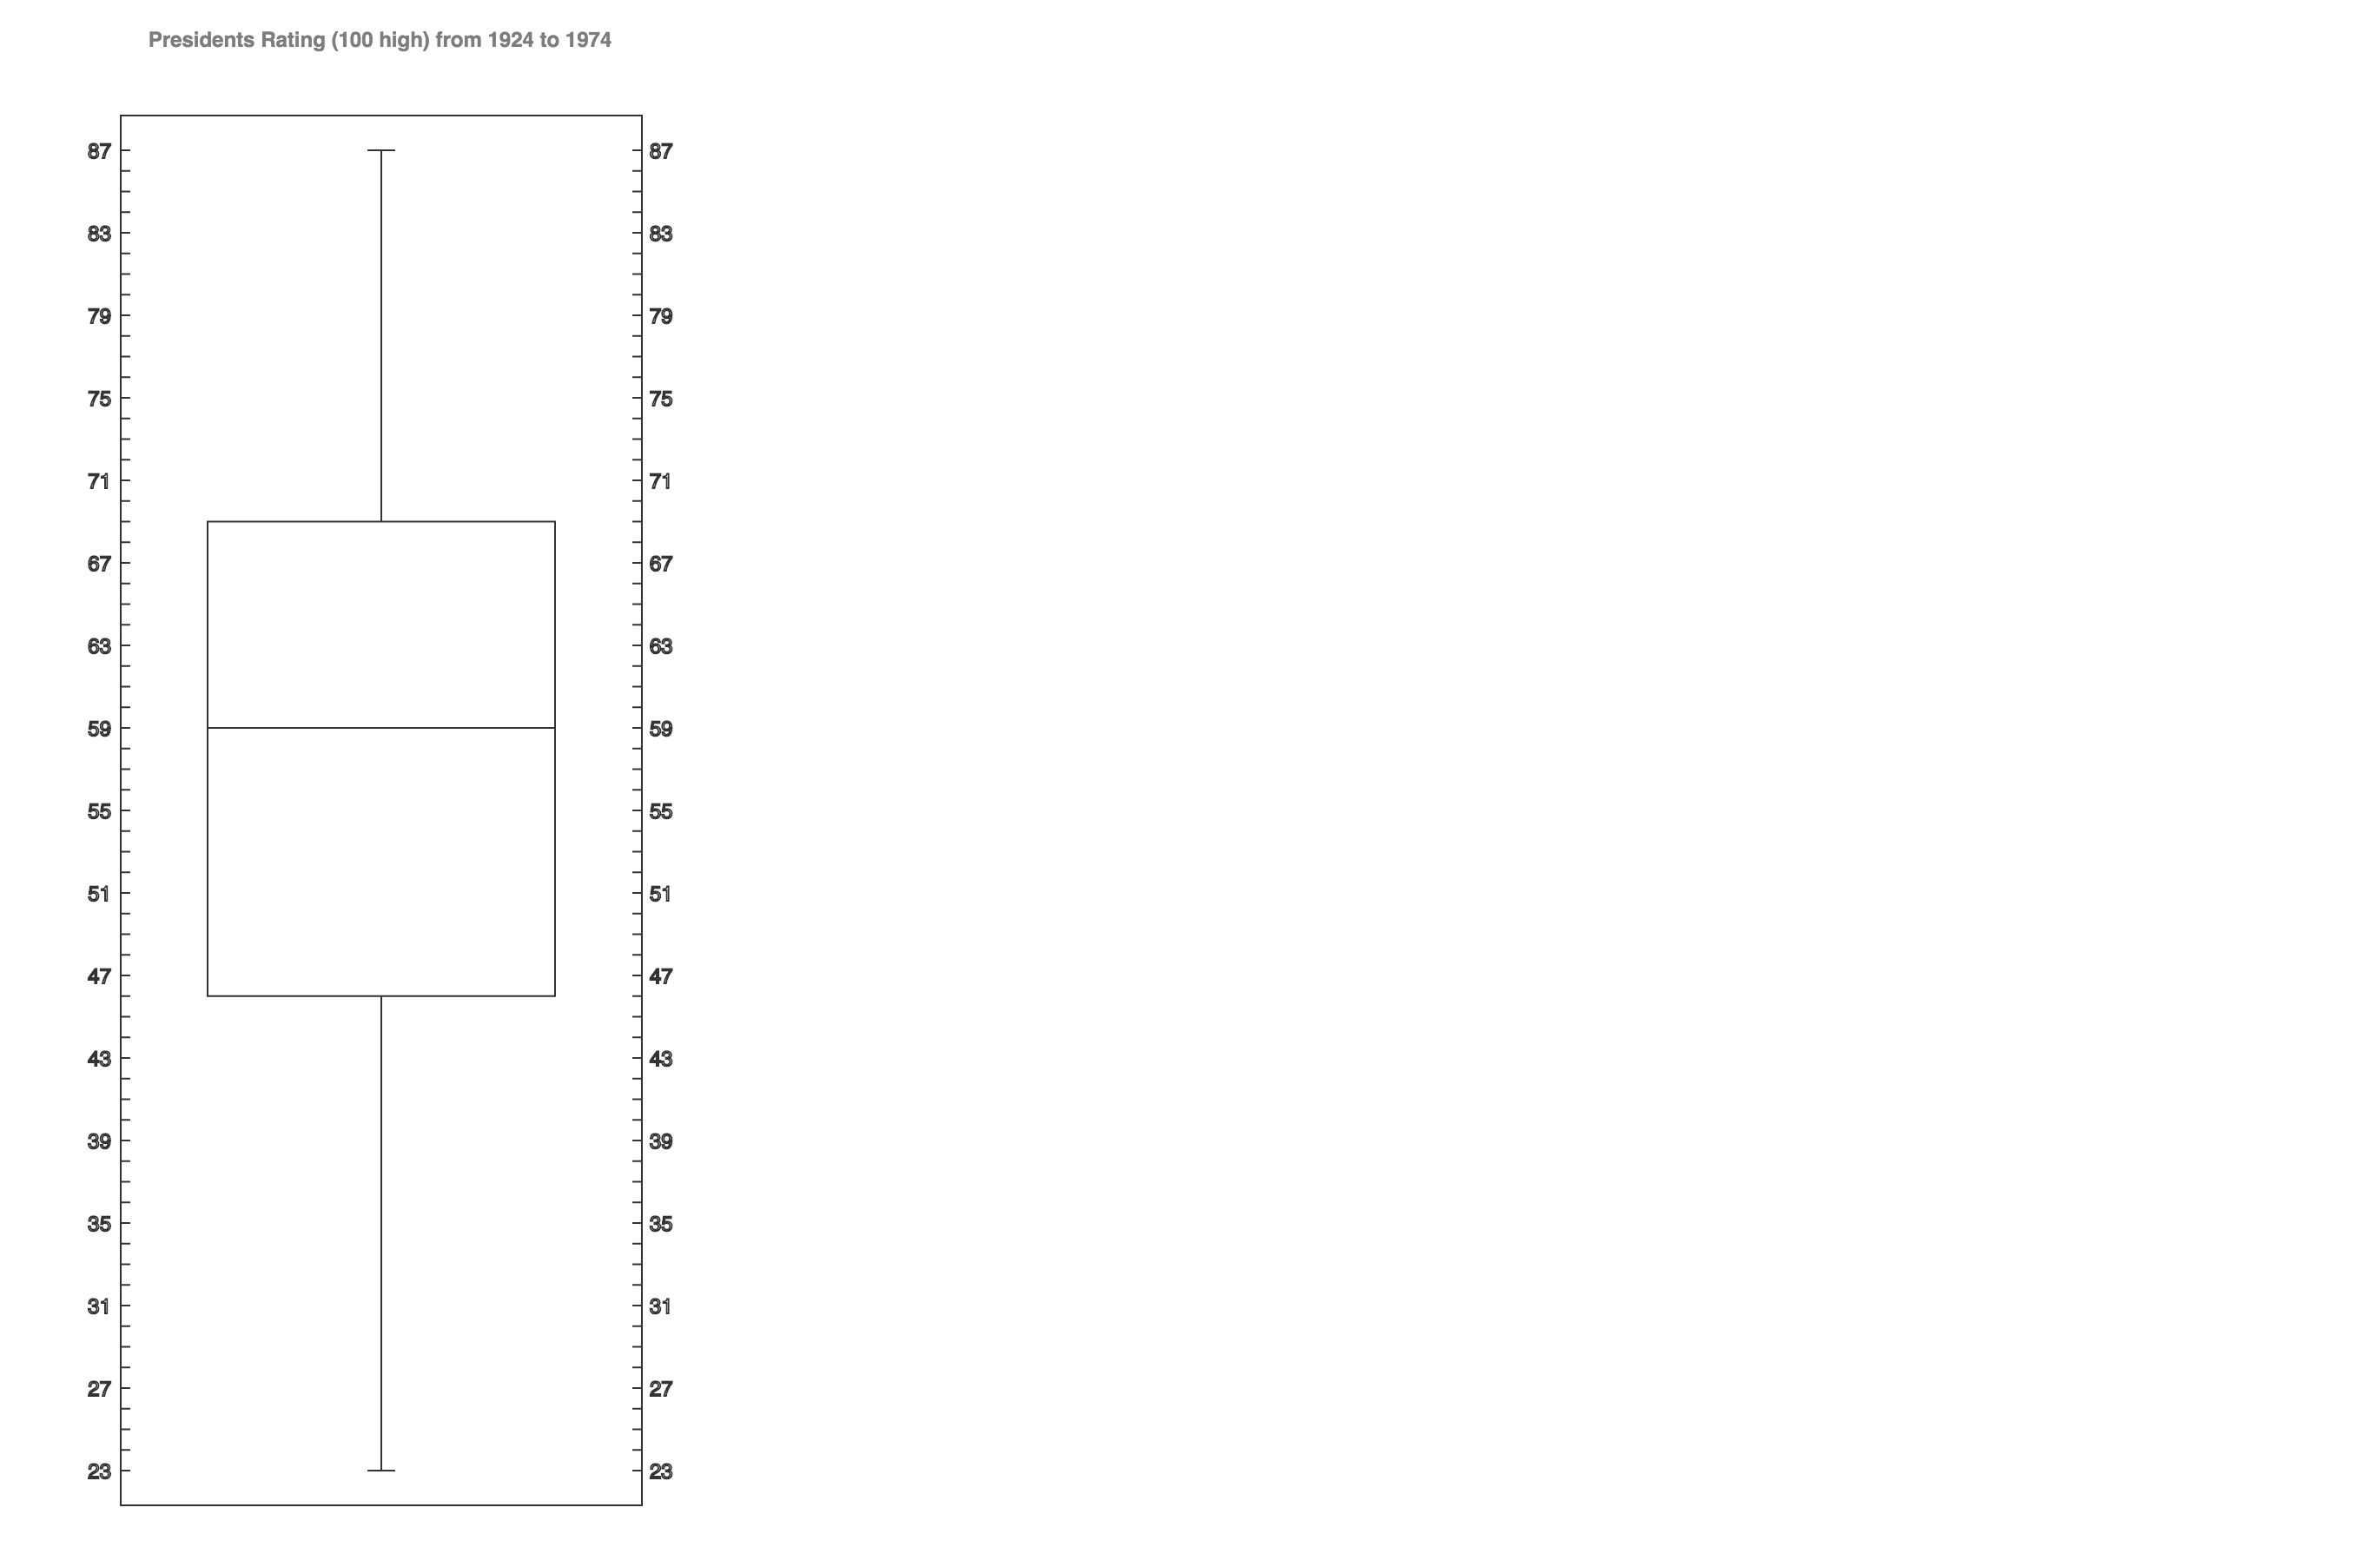
- Showing the same dataset using bar chart, stacked bar chart, scatterplot, line graph and box plot.
- All vis are interactive (highlighting and showing tooltips) except for box plot.
Links
Note
Below is a faked dataset to show outliers. The faked test data can also be acquired here.