README
This is a really simple version of CSV visualizer implemented using JAVA and Processing. To download the source code and executable, please click here. Simply double-click on the jar file to execute. You will get the test data after extracting the .zip file.
Note: You might need to install JRE6 on OSX to execute the jar file.
It has several features:
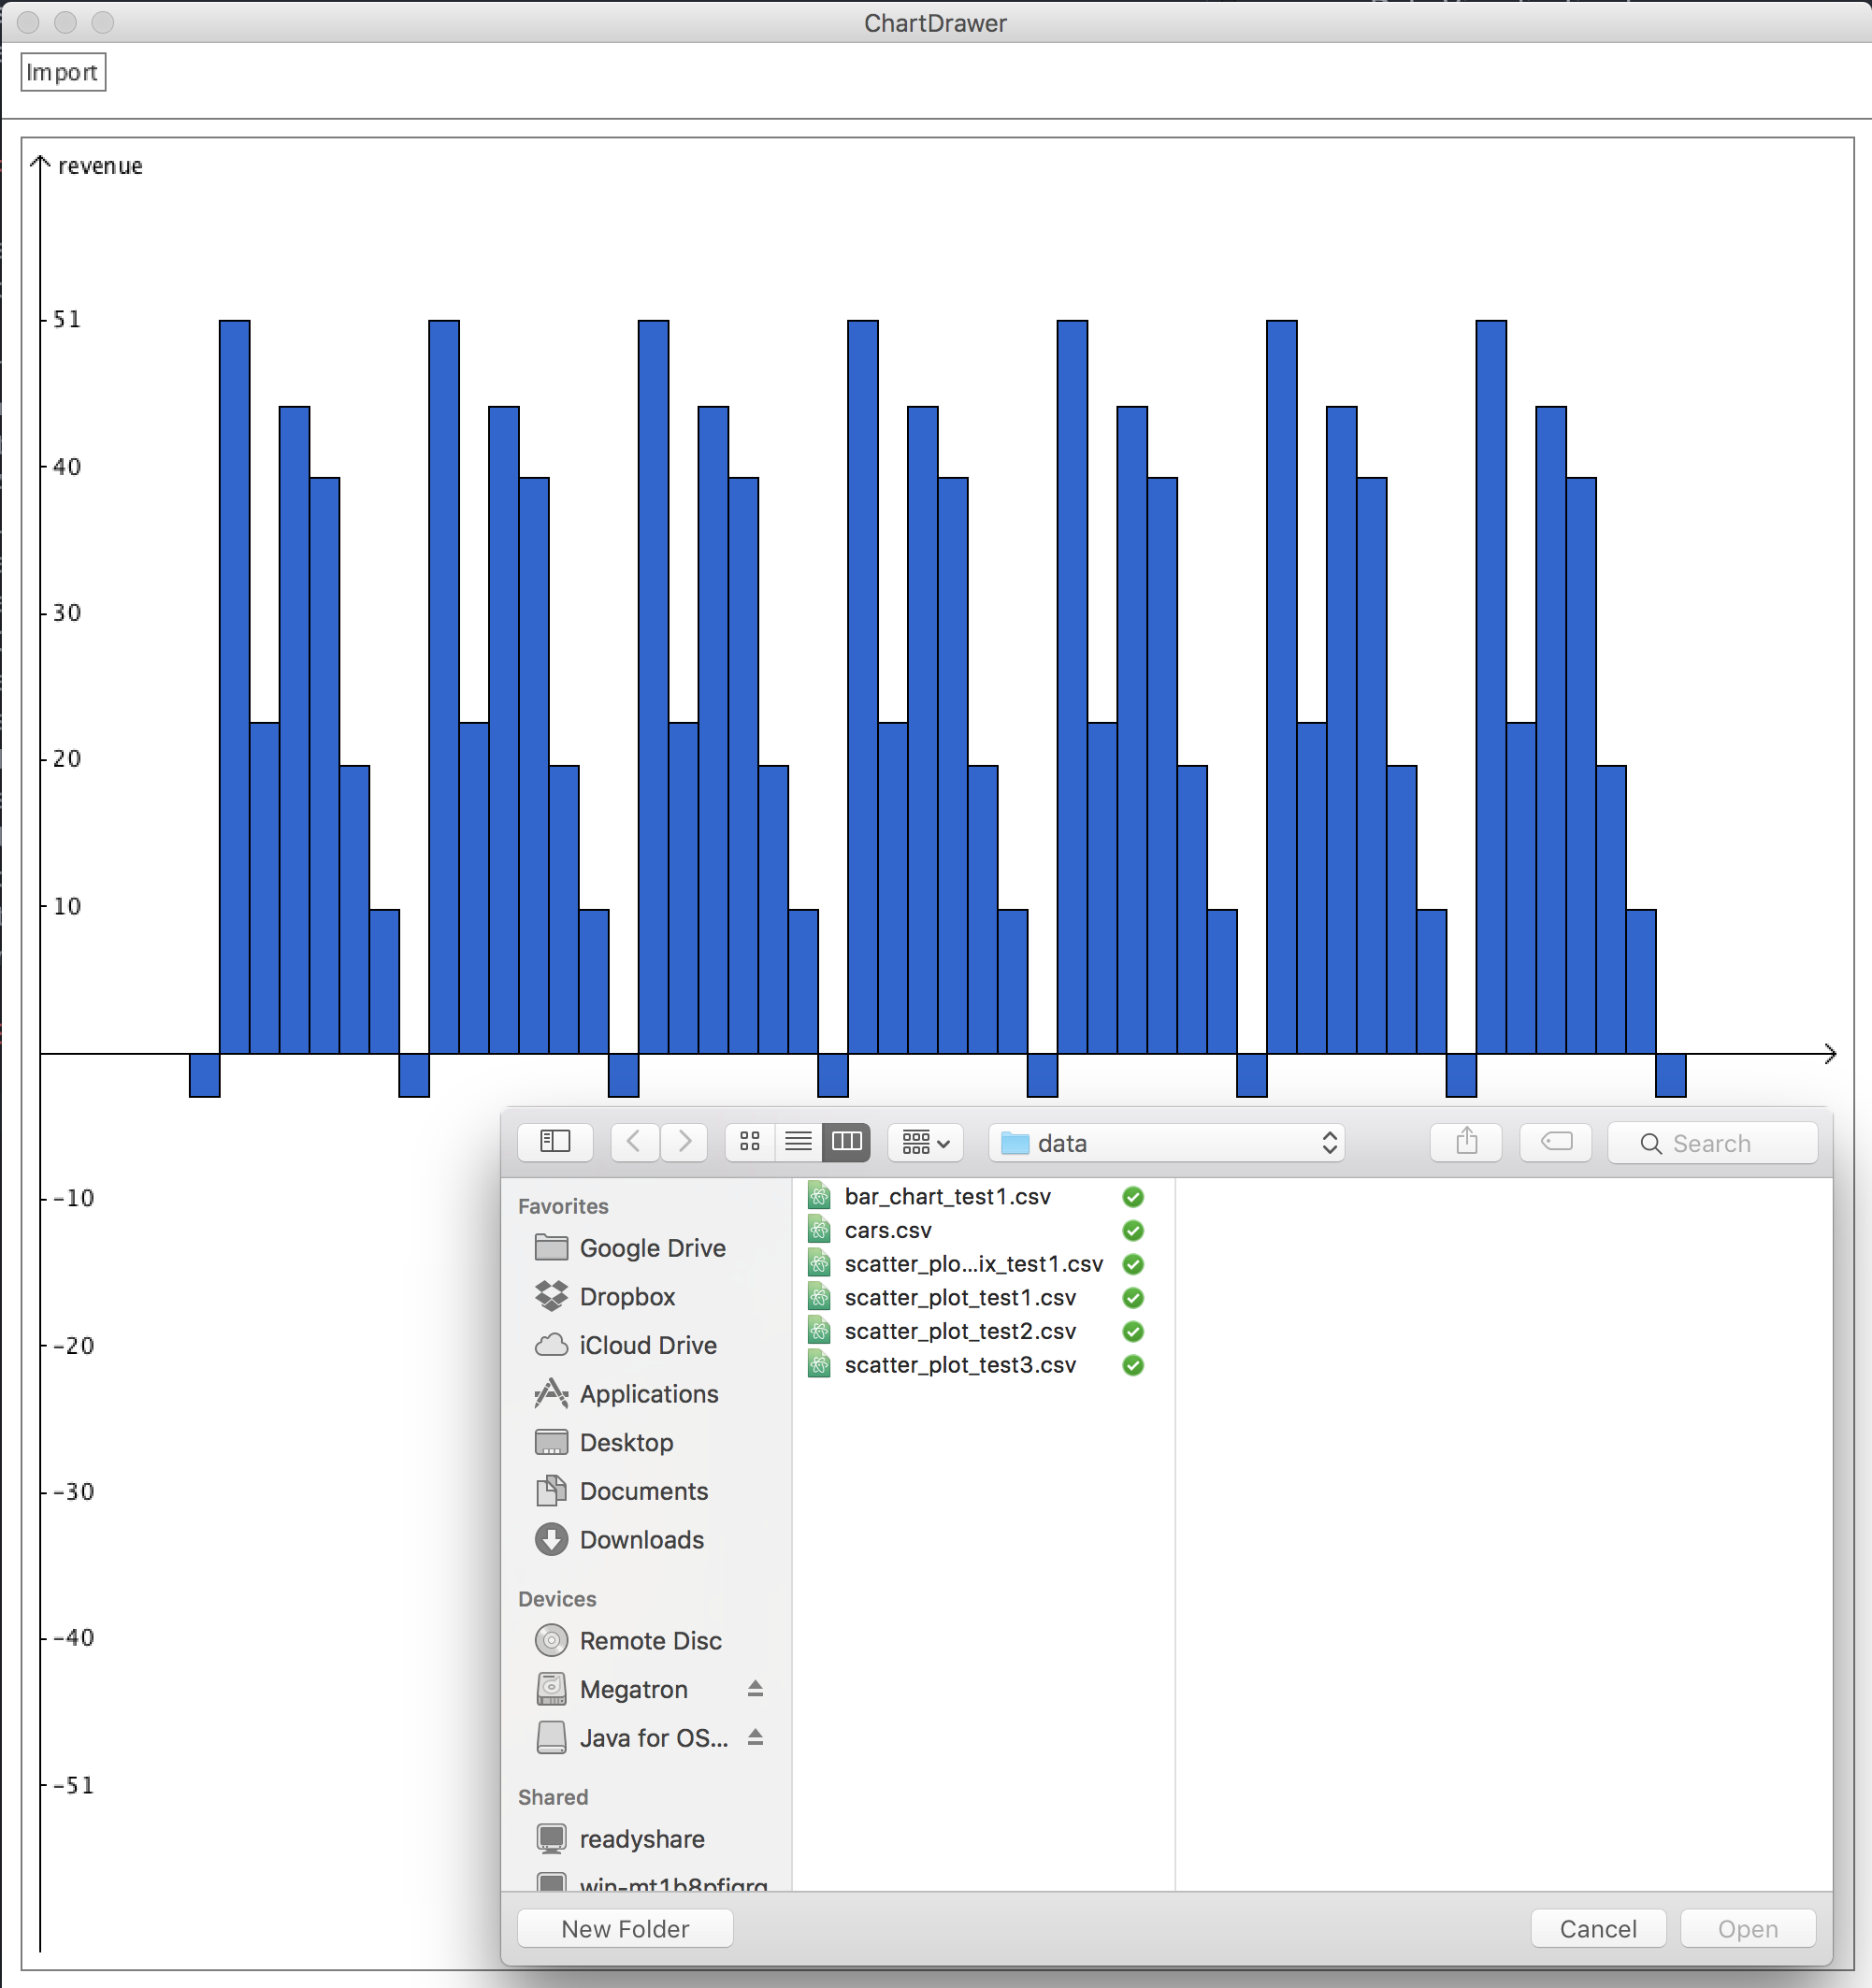
- You can use the “Import” button to select the input CSV file. The file must contain a header for its columns.
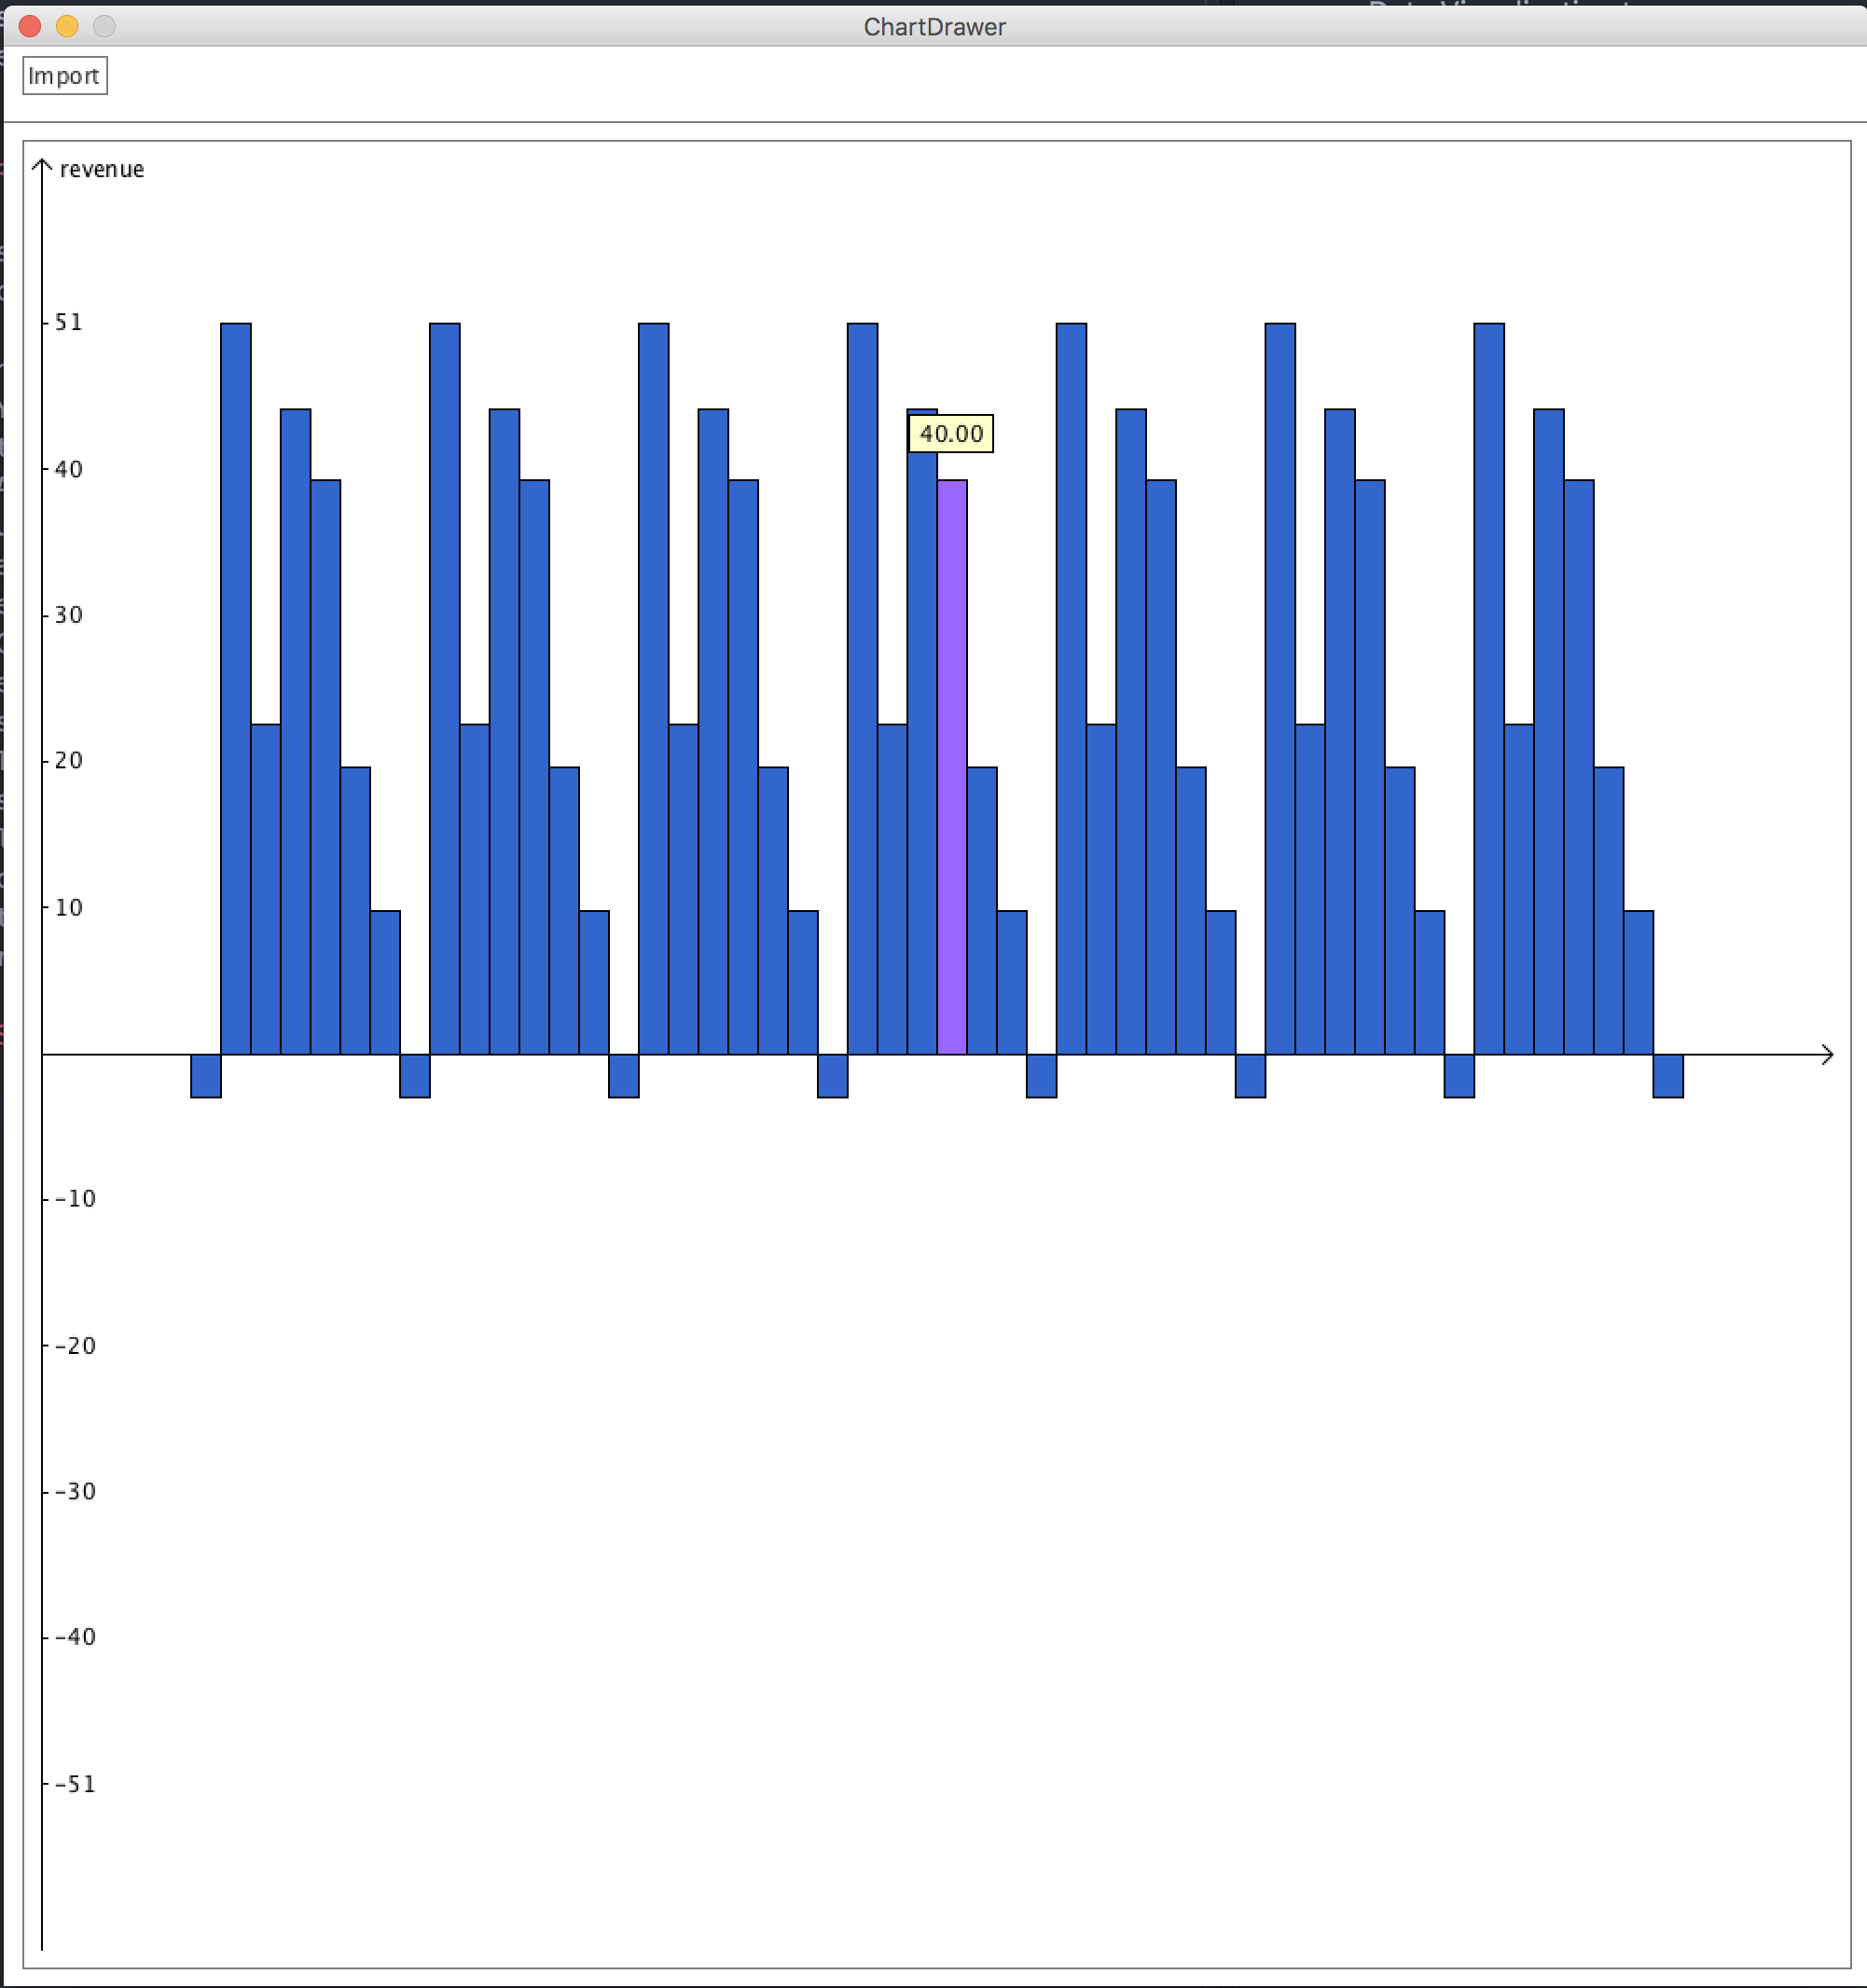
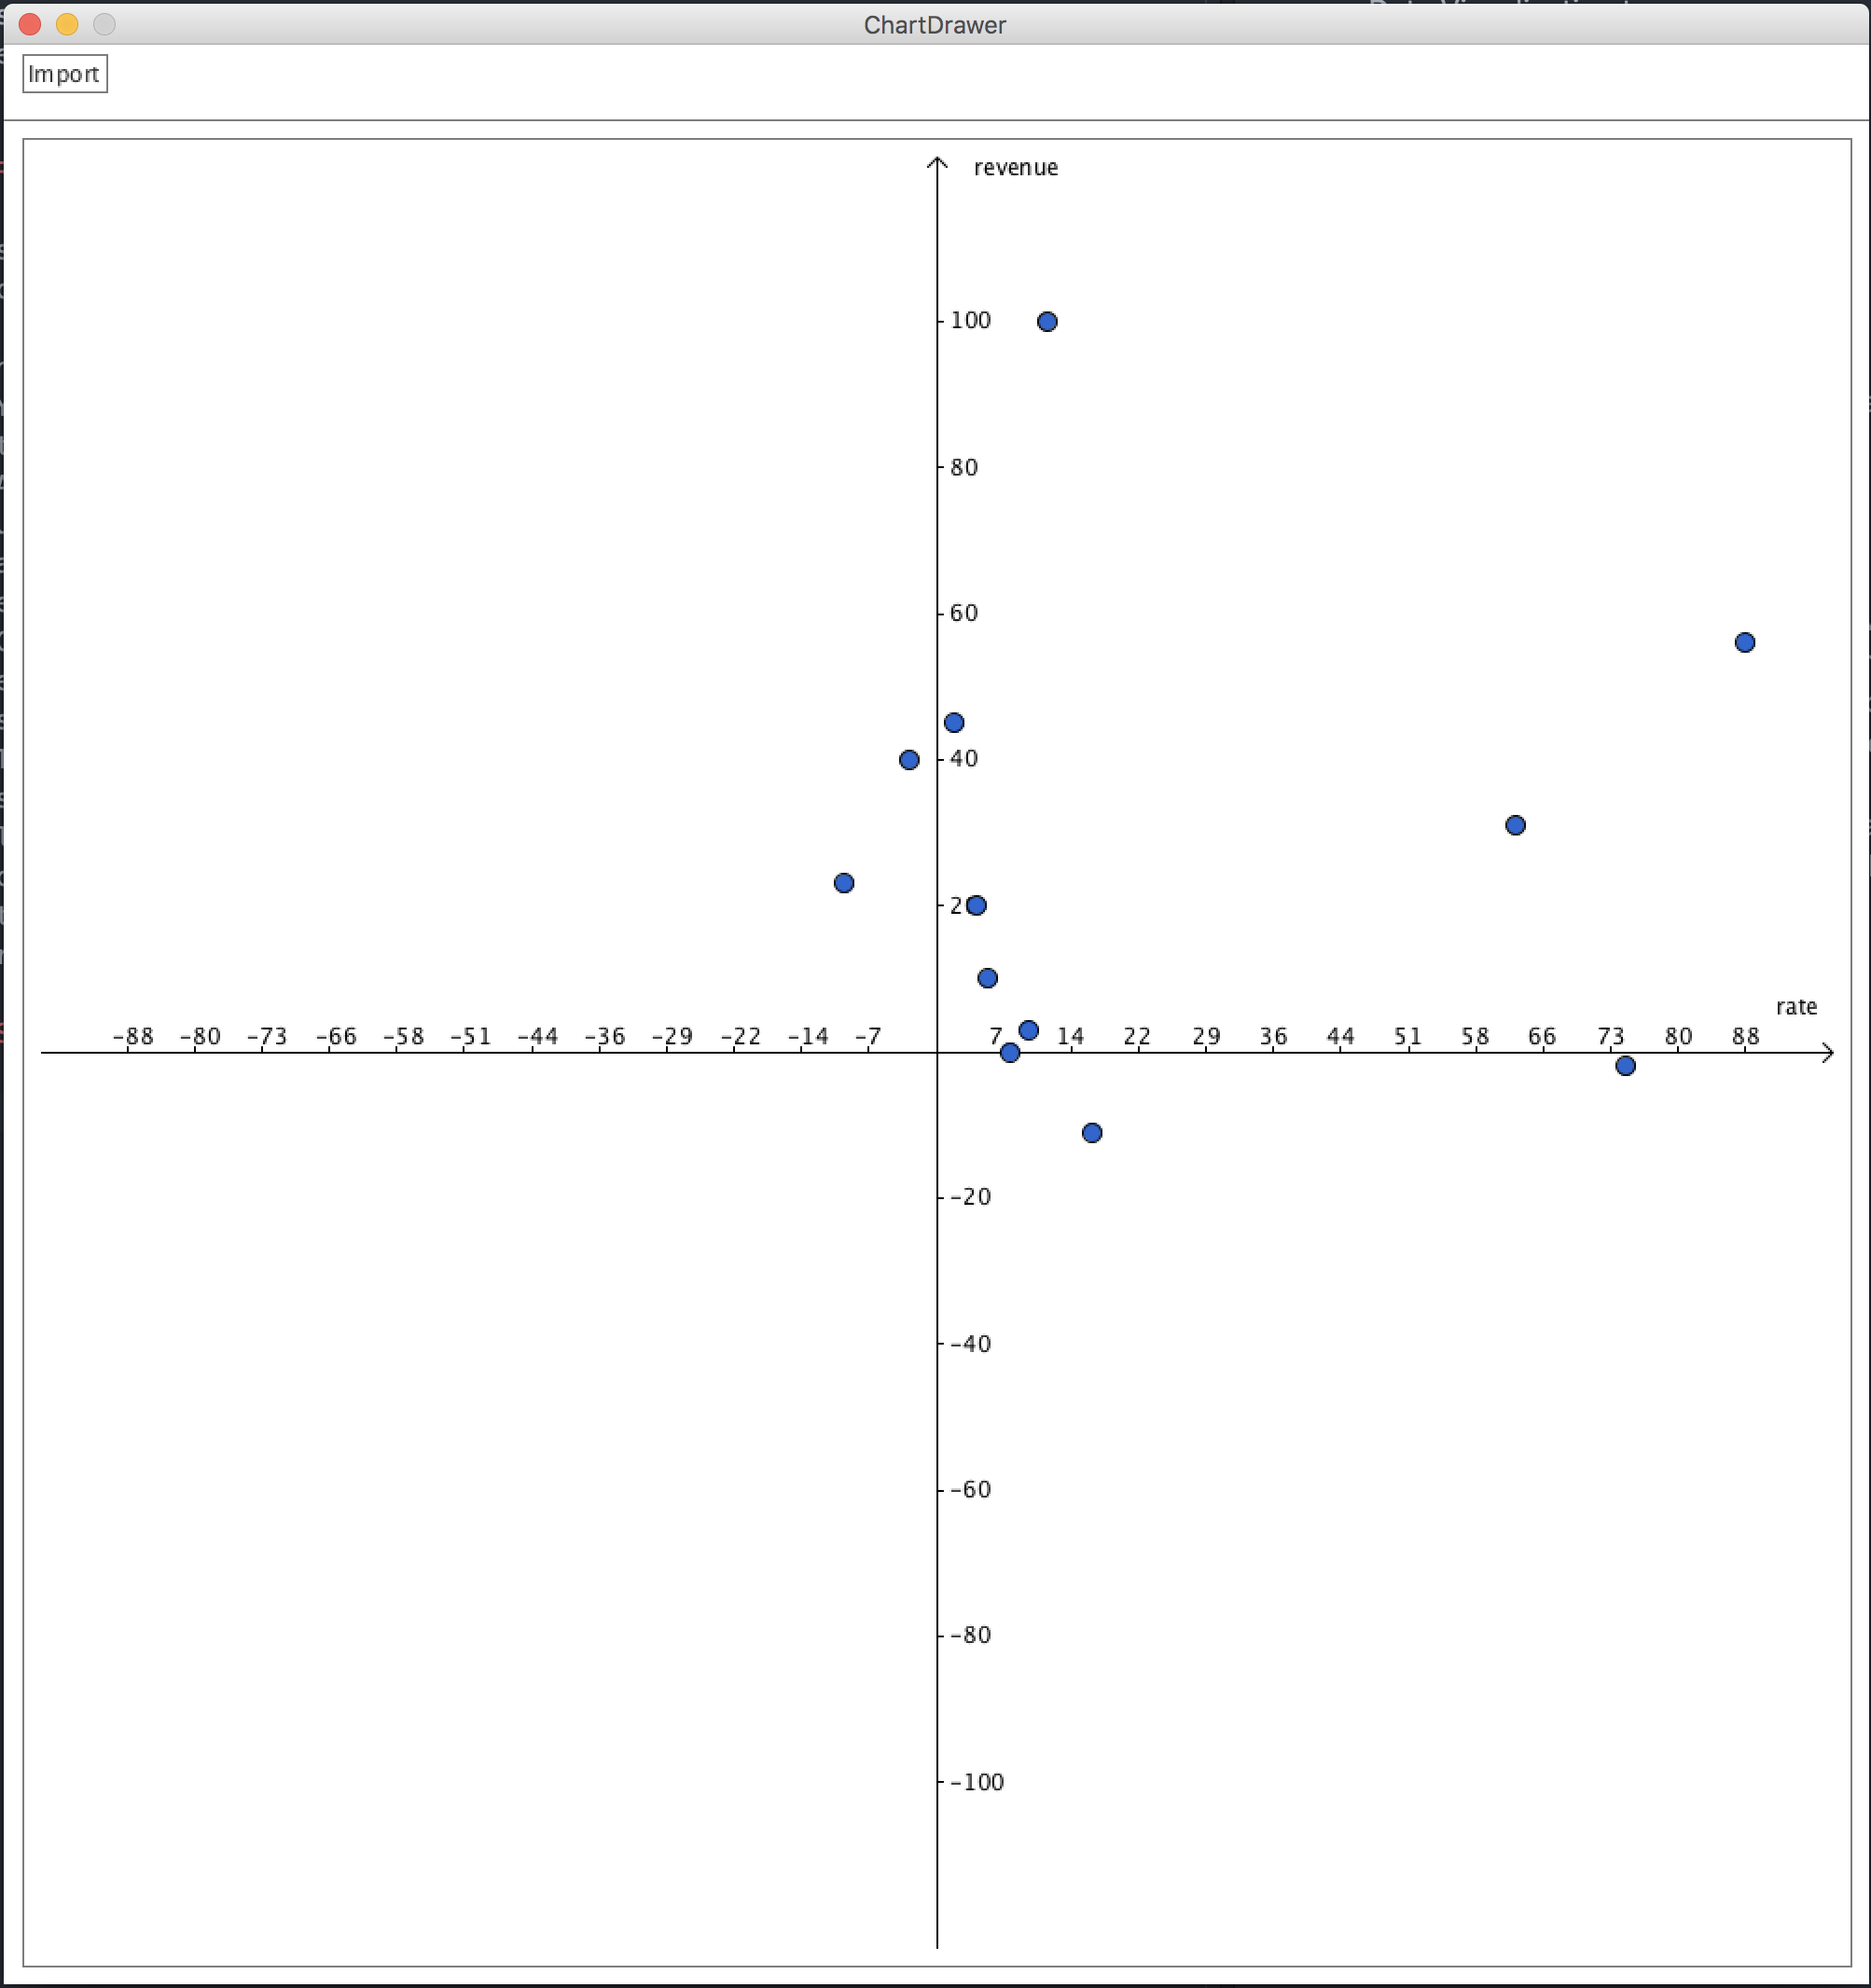
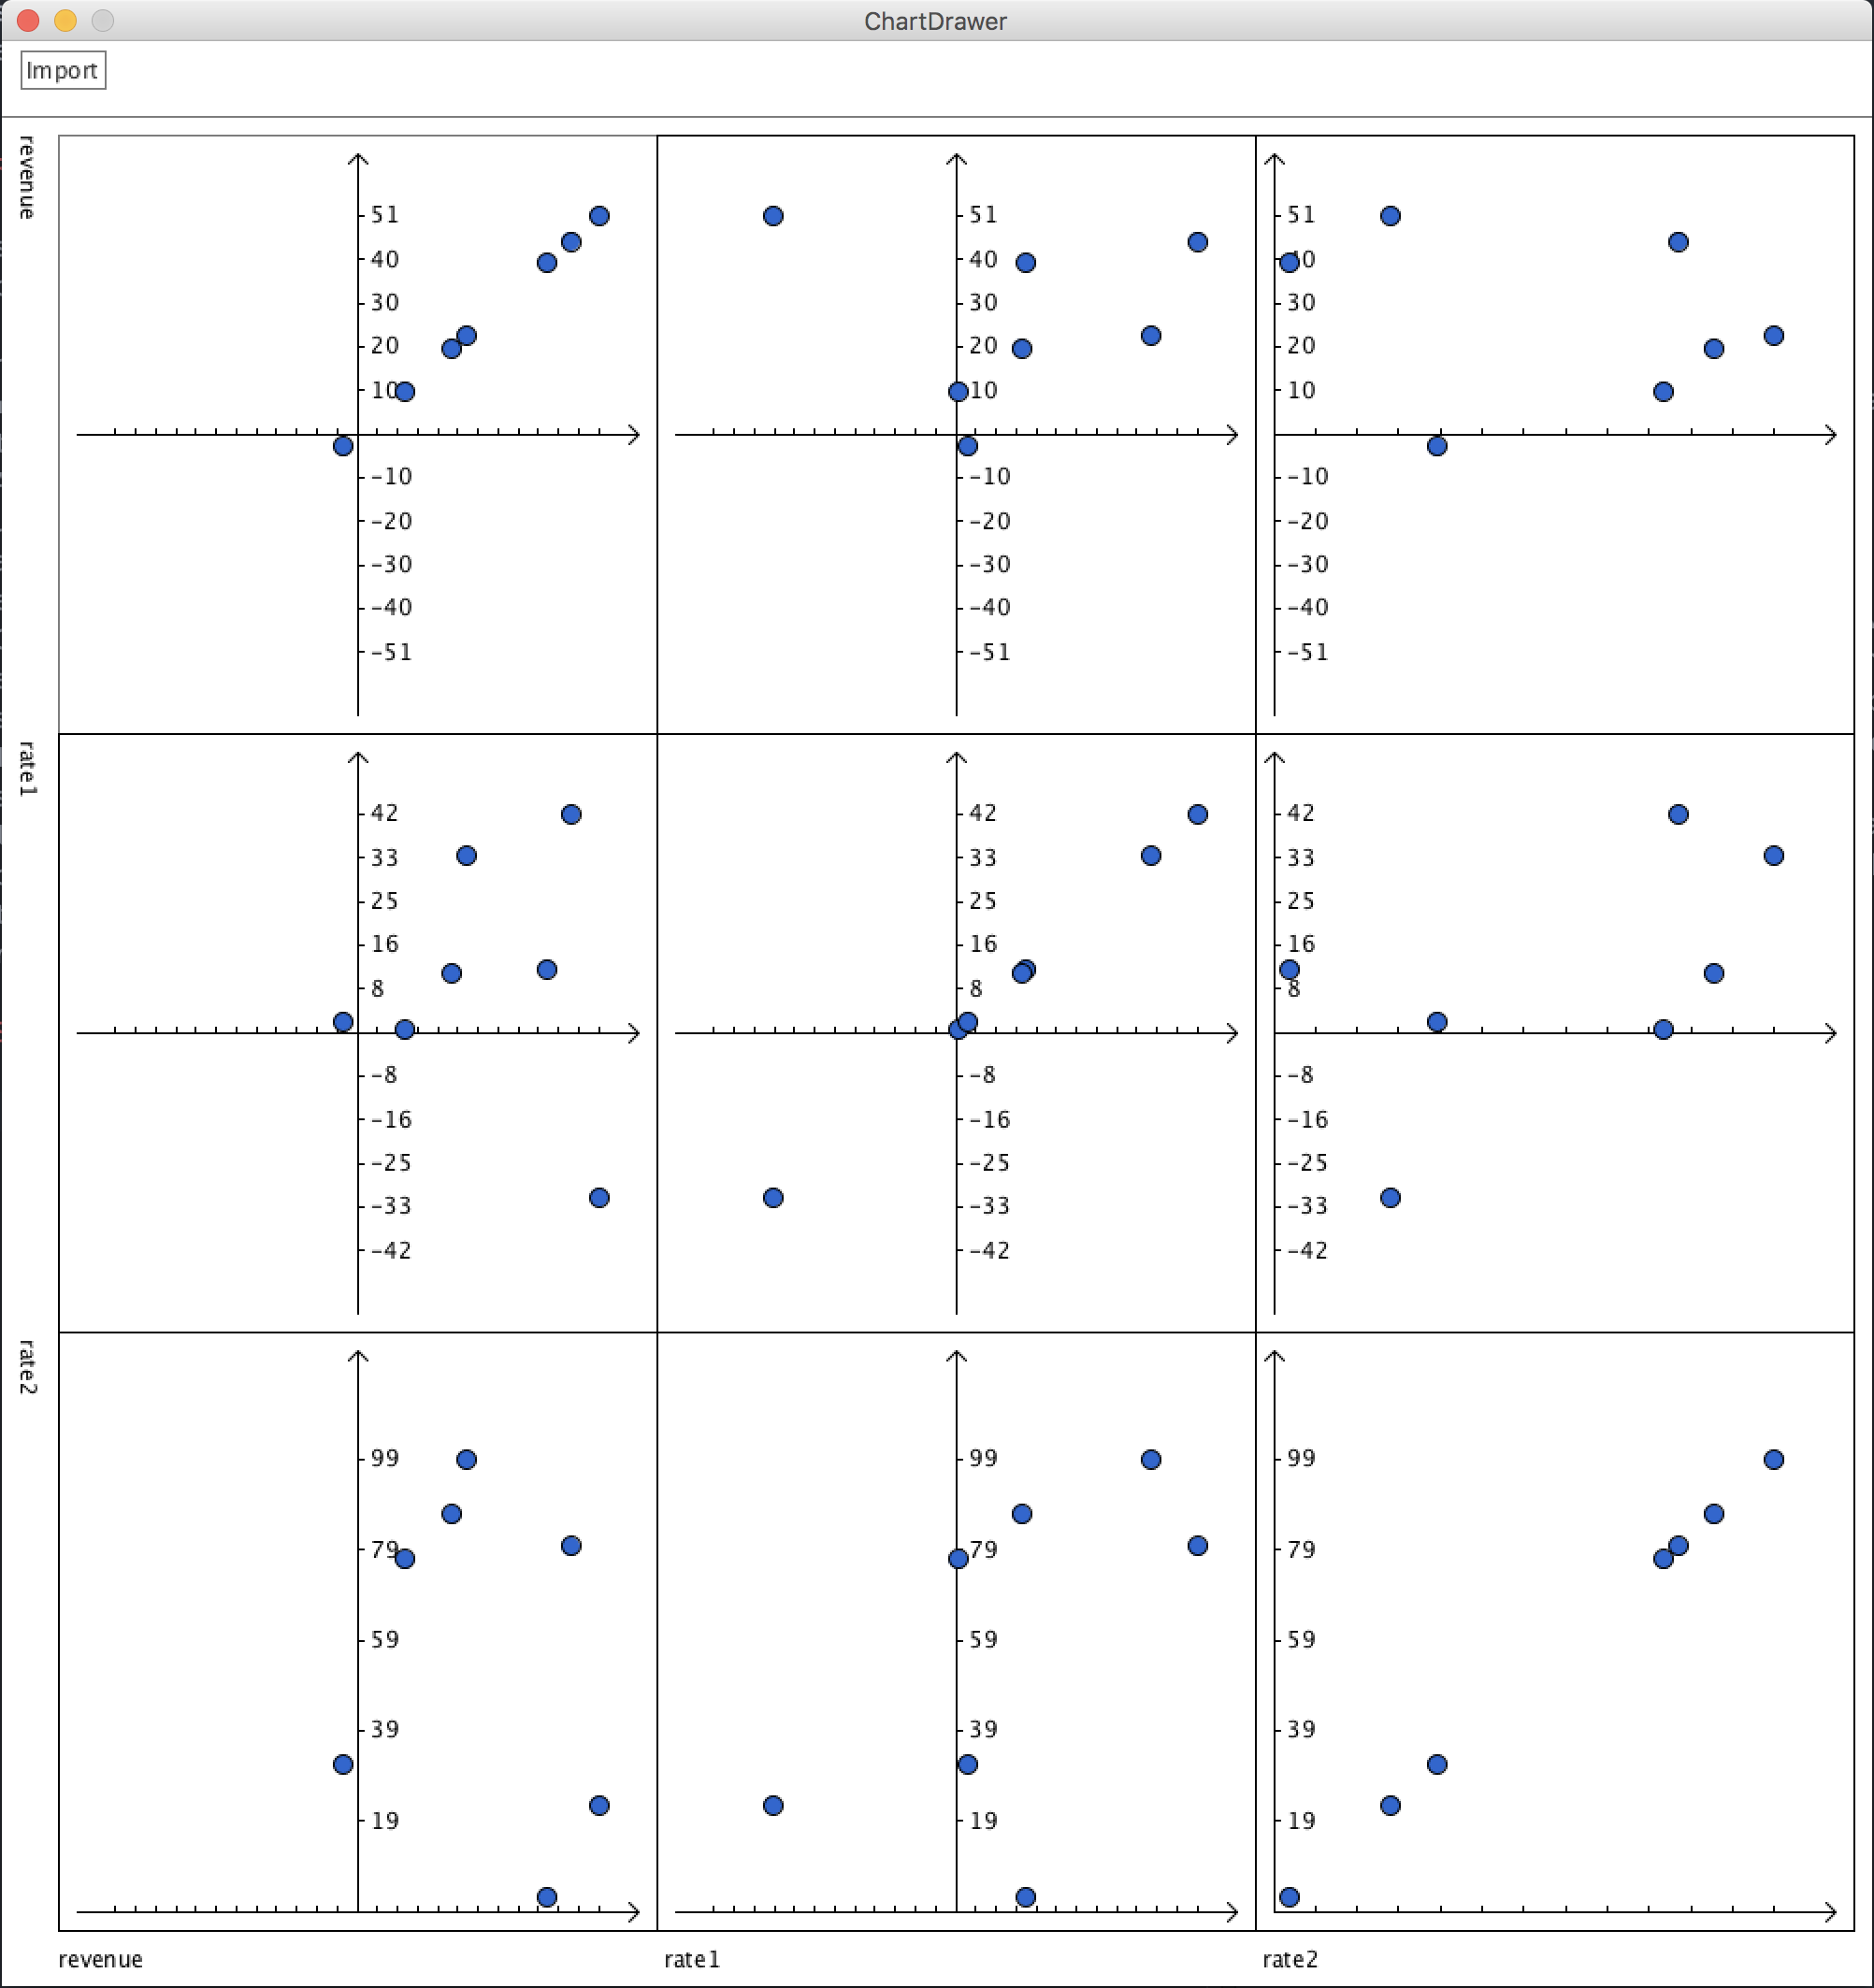
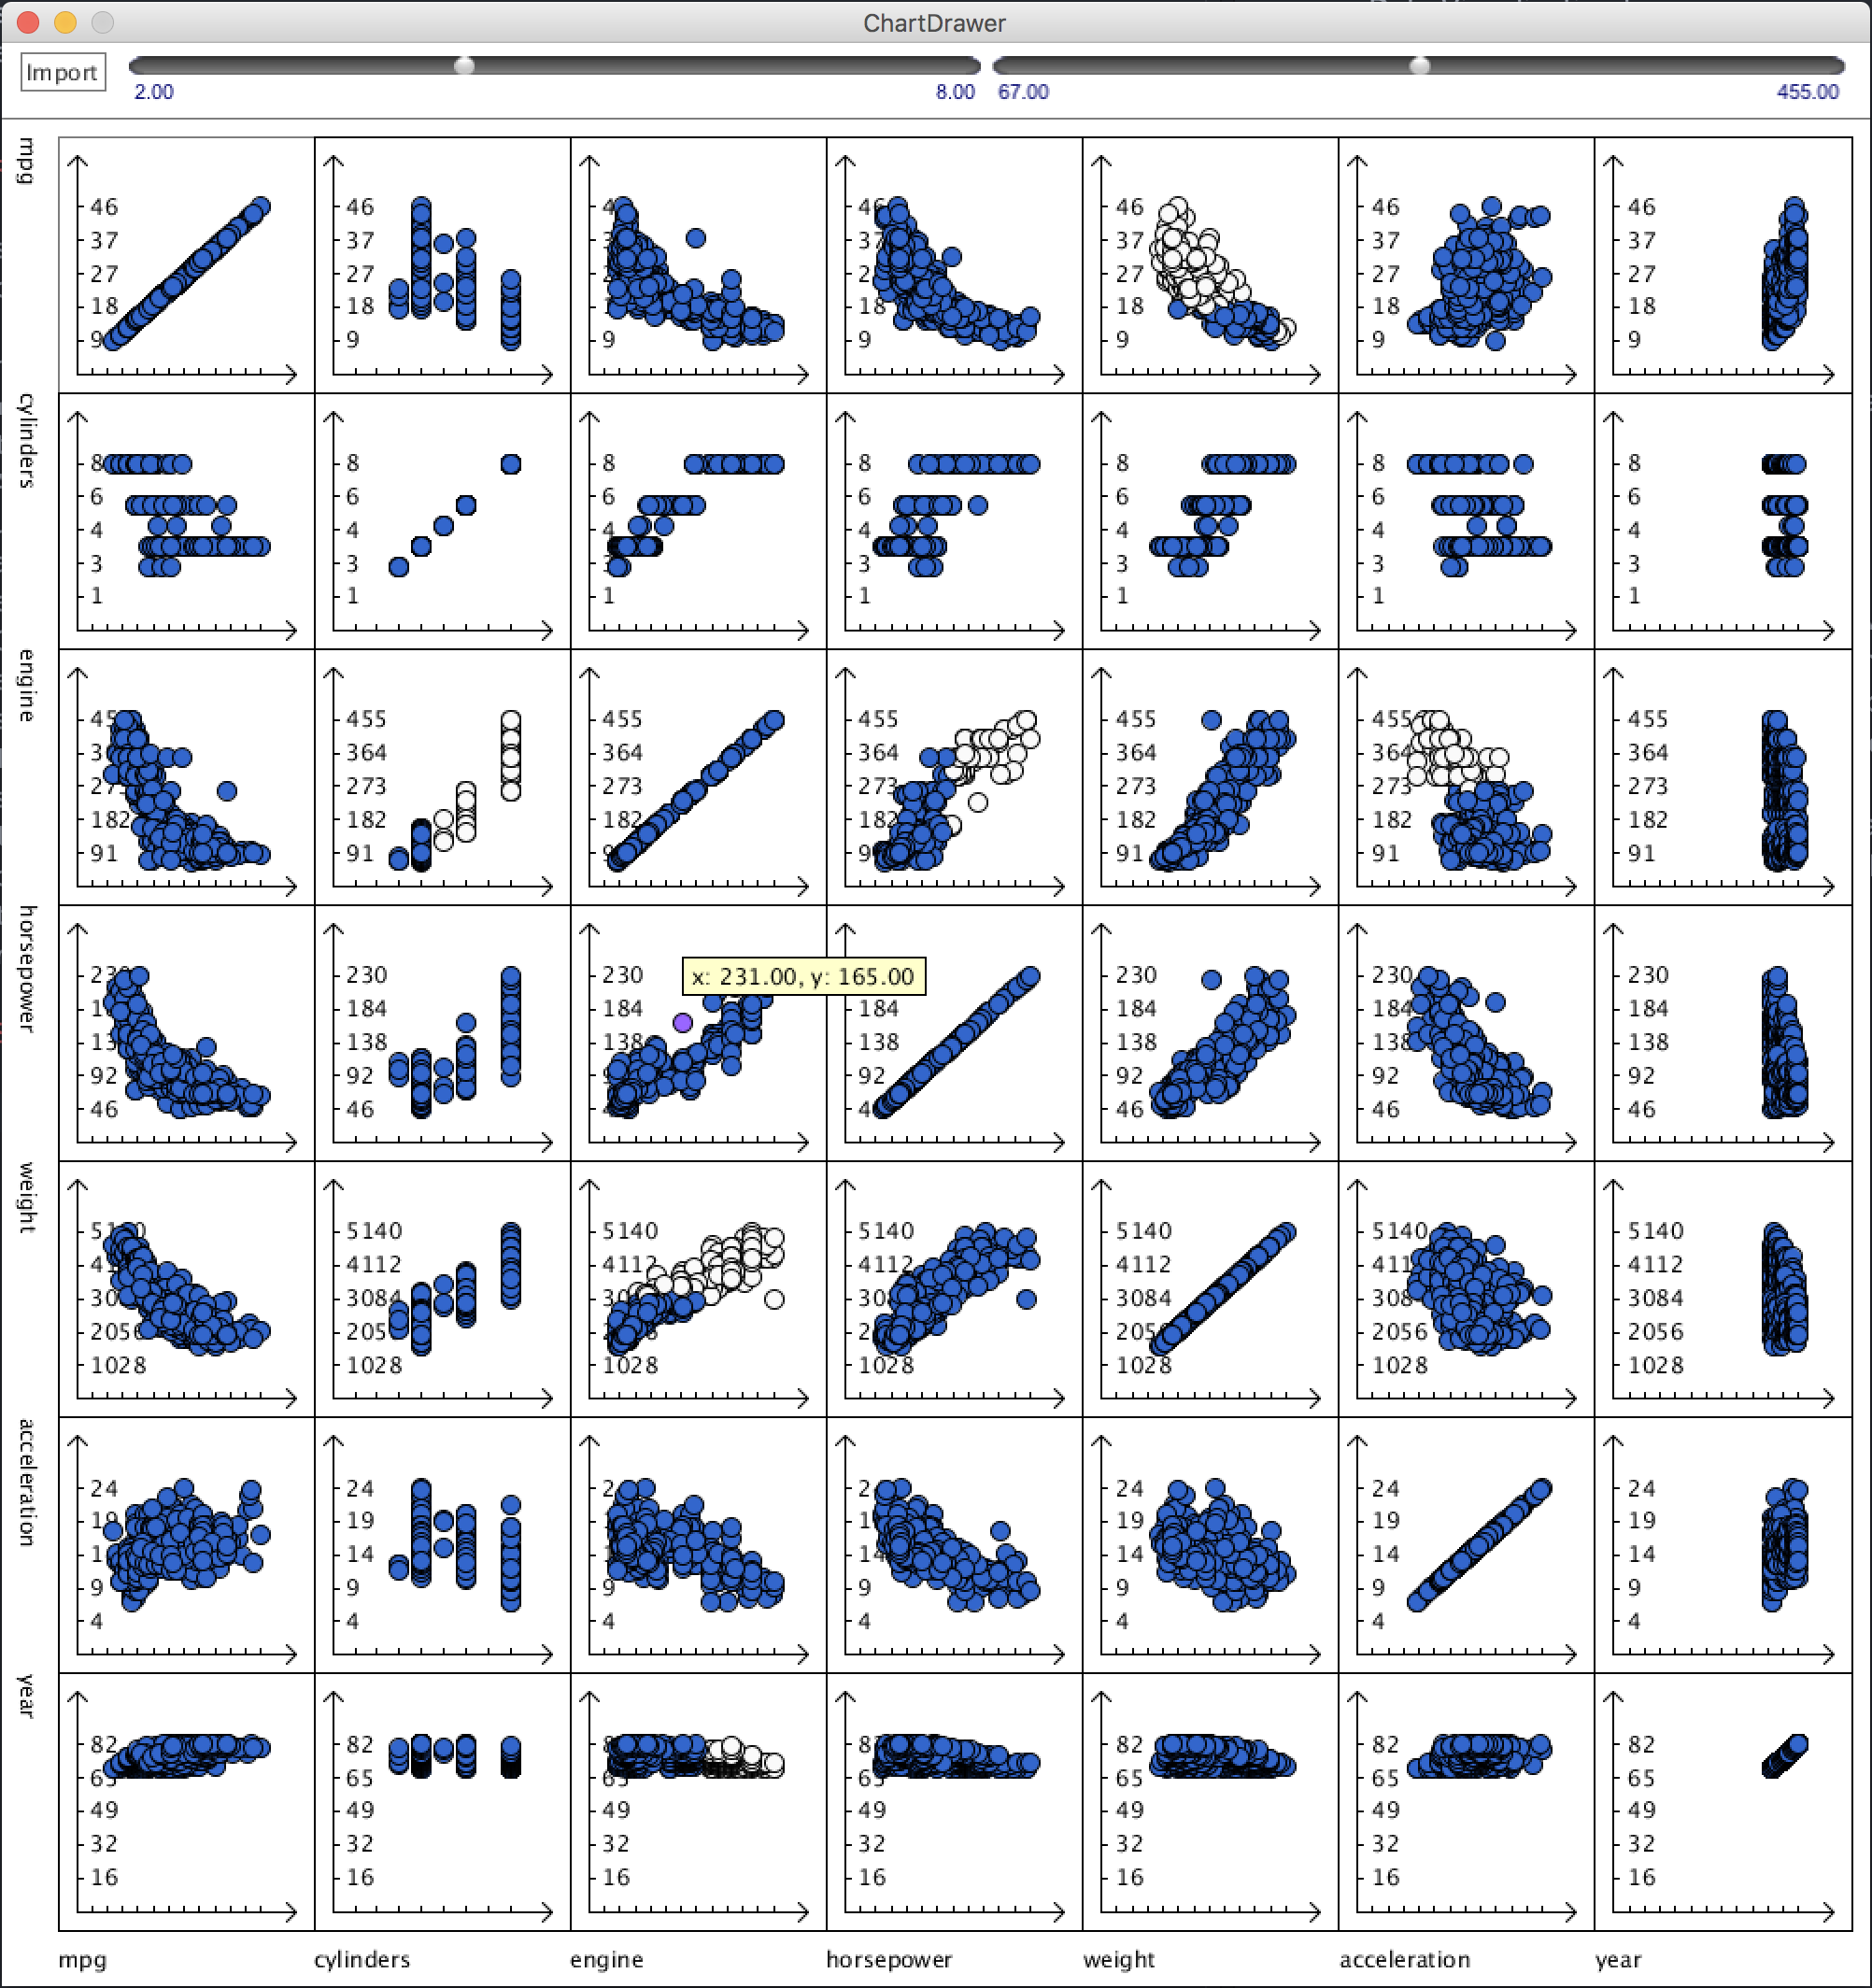
- After importing the file, the CSV Drawer will recognize the dimension of the input data and visualize the data using either a bar chart (1 dimensional data), scatterplot (2 dimensional data) or a scatterplot matrix (3 or more).
- Currently this vis only supports number based input. Which means for a CSV file that contains NAN values (like strings in a column), the data points will be skipped. And if the whole column is NAN, then the whole column is skipped.
- The vis implements basic user interactions. a) When the user moves the mouse over one data point the data point will be highlighted and a small tooltip will illustrate the actual data for this point. b) If user clicks on a specific chart, there will be slider(s) appearing to the right of the “import” button. And user could use the slider(s) to filter the data displayed on the chart. Note: For scatterplot matrix you need to click on the small graph in the grid to display the sliders for that chart.
Screenshots
Insights on the Car Data
By looking at the last picture in the screenshots section above, it certainly revealed some interesting patterns in the car dataset.
Insight 1


The little screenshot above combined with the minimum value for the slider tells us that the earliest year of the whole dataset is 1969. (Maybe domestic car is not widely manufactured before that time?)
Insight 2
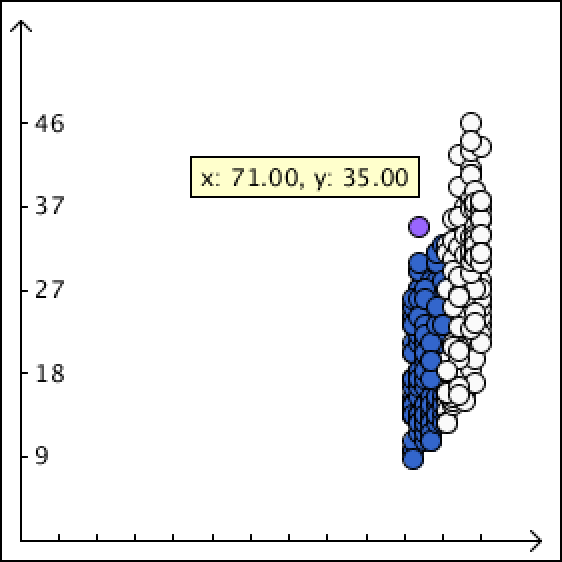
In this screenshot we can see a point is left alone. And it becomes very clear after filtering that the highest MPG (miles per gallon) we can get in 1971 is 35. (And it’s way higher than peers!)
Insight 3
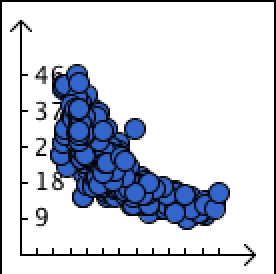
From this screenshot I know even without very sufficient common knowledge about cars that: the higher the horsepower, the lower the mpg we get from a car.
And seems this link verifies this conclusion.