The Car Data
Let’s dig deep into our good old car data. This time we are going to answer 6 car related questions, each one will have a picture associated.
Which car has the highest city mpg?
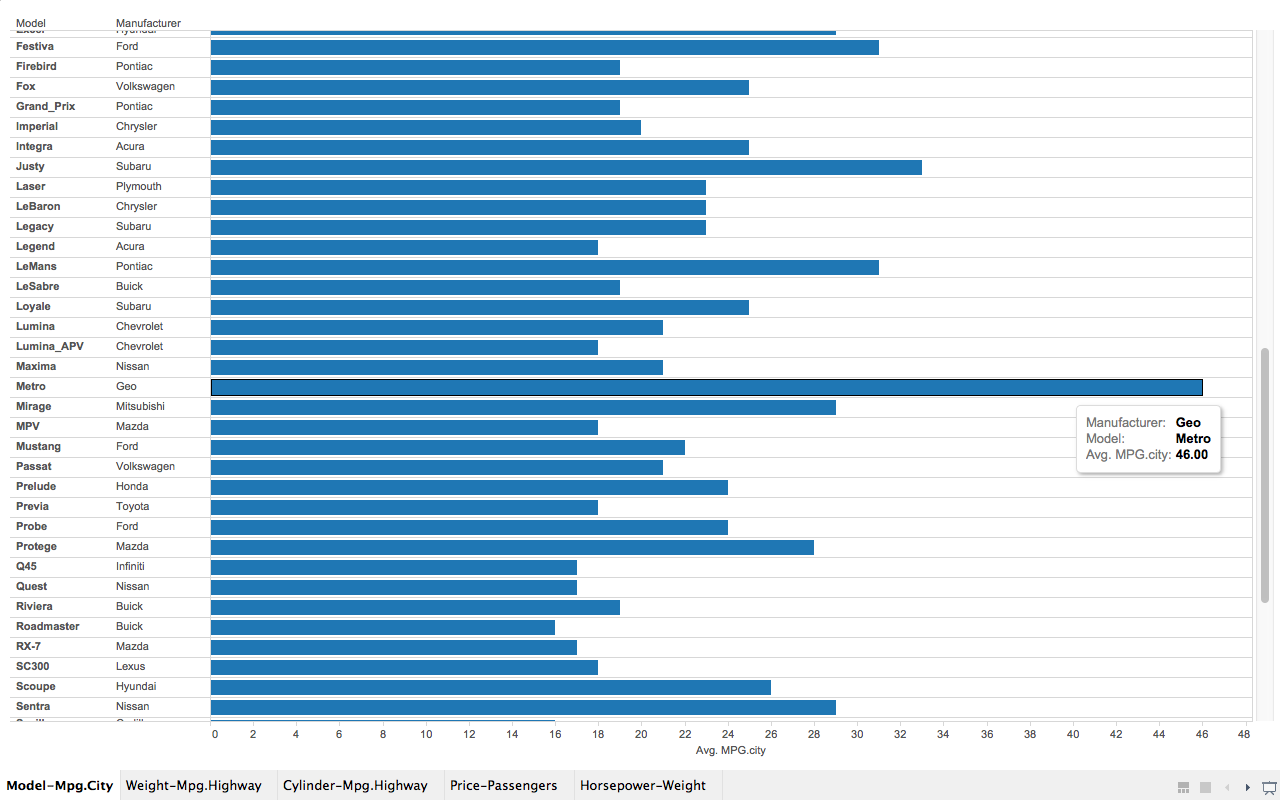
Answer:
Geo Metro has the highest city mpg.
How:
Set the manufacturer-model tuple as the column dimension and city MPG as the row measure, we can get the data simply even without any filtering.
Is there a correlation between a cars highway mpg and its weight?
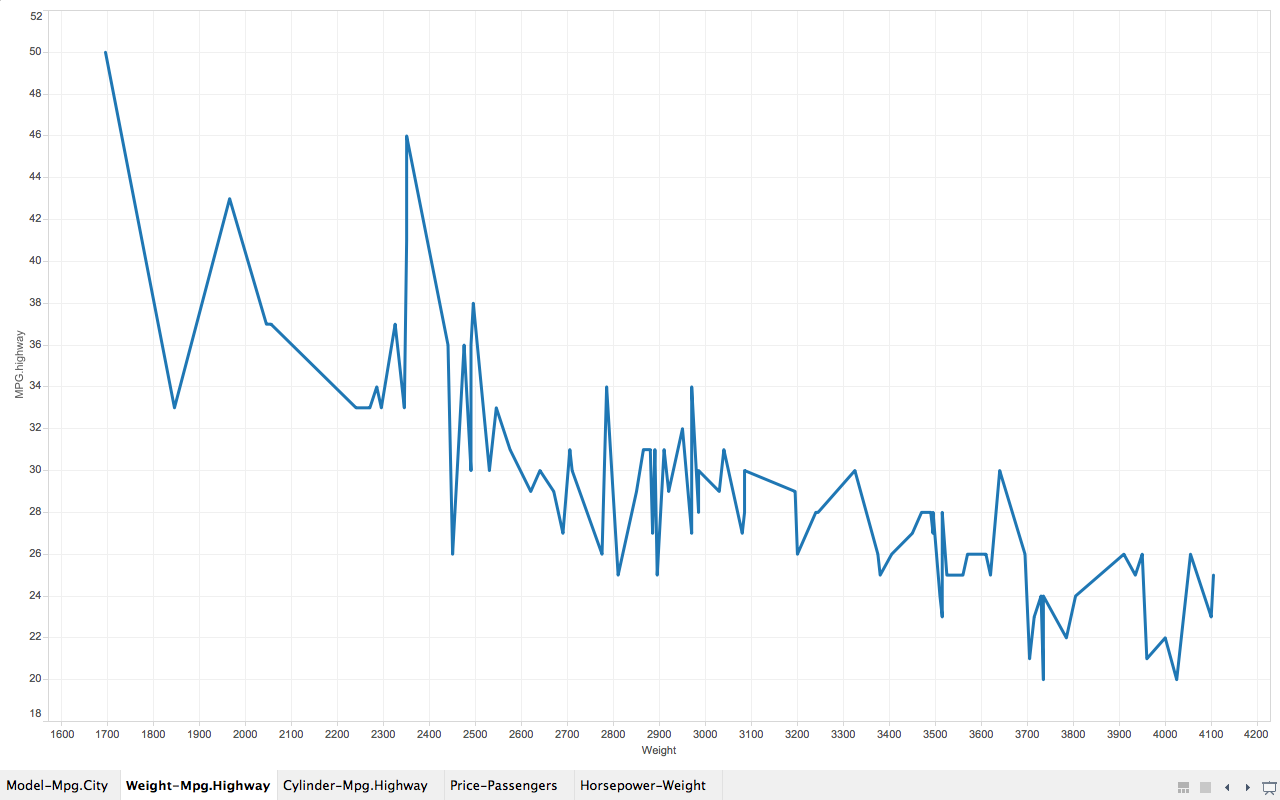
Answer:
There is a reverse correlation between a car’s highway mpg and its weight.
How:
Drag weight and highway MPG to row and column respectively and set both of them to dimension by clicking the menu item in the dropdown of each dimension. Ugly as it may perceive, we get the correlation immediately.
Which car has six cylinders and still has a highway mpg that is above 30?
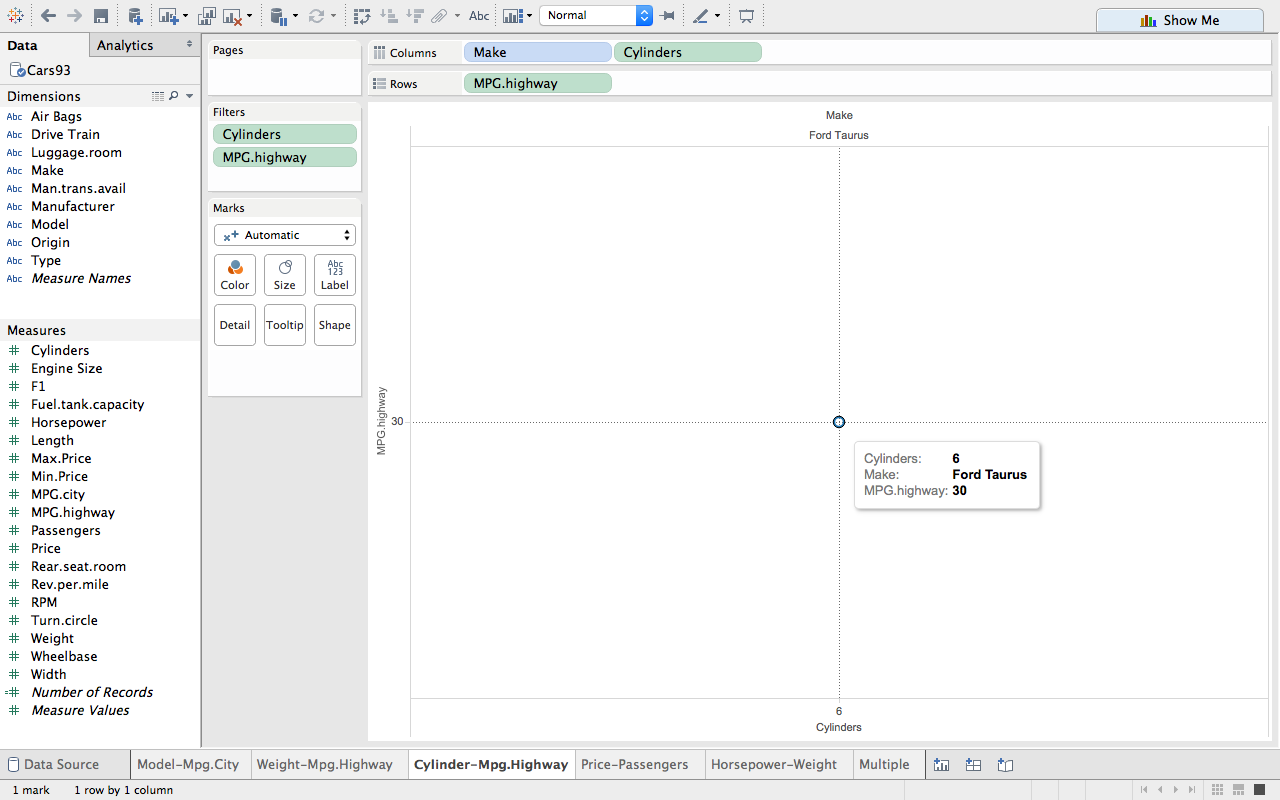
Answer:
Ford Taurus.
How:
Do the similar drag-and-drop as before, but this time we need to apply two filters to nail number of cylinders down to 6 and highway mpg to 30. And we got only one point on the chart.
Which is the most expensive 5-seater car?
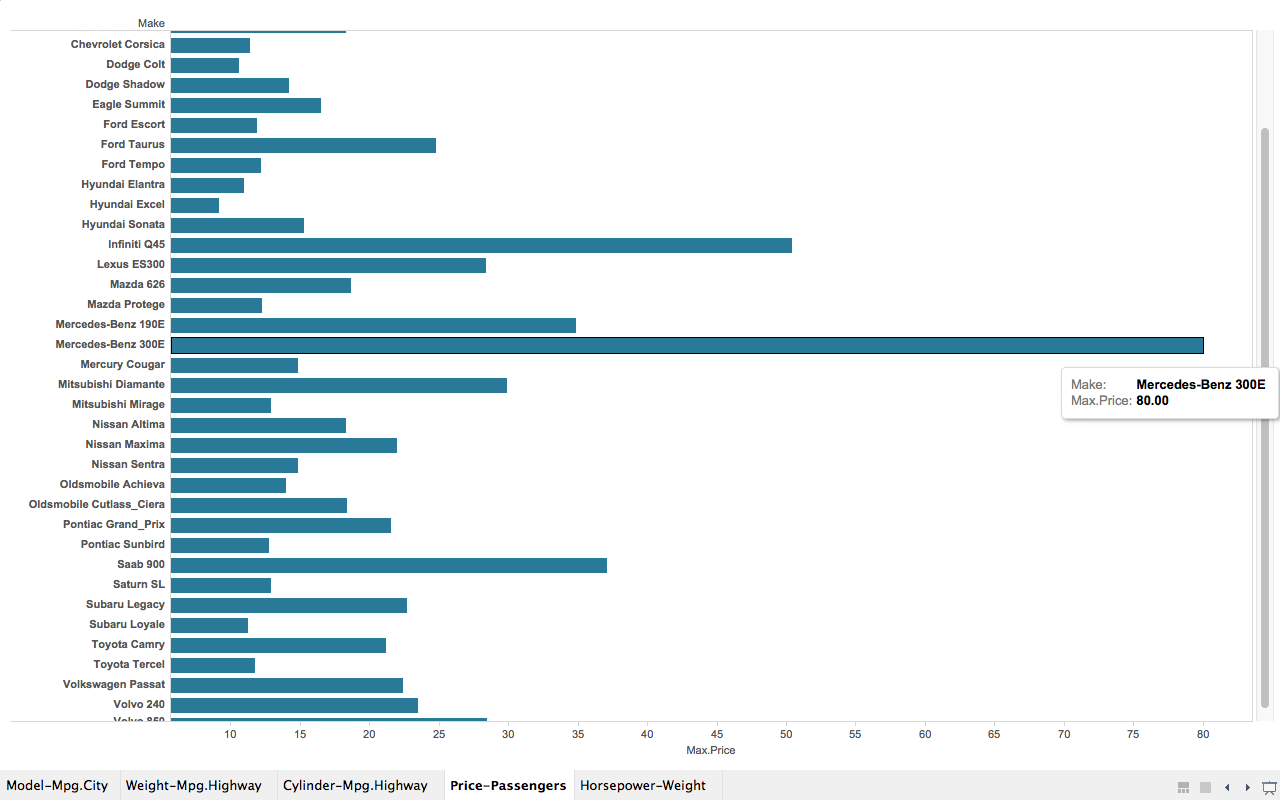
Answer:
Mercedes-Benz 300E.
How:
Drag-and-drop, apply filter to 5 passengers and boom..
Is there a relationship between a cars horsepower and its weight? If so, what is it?
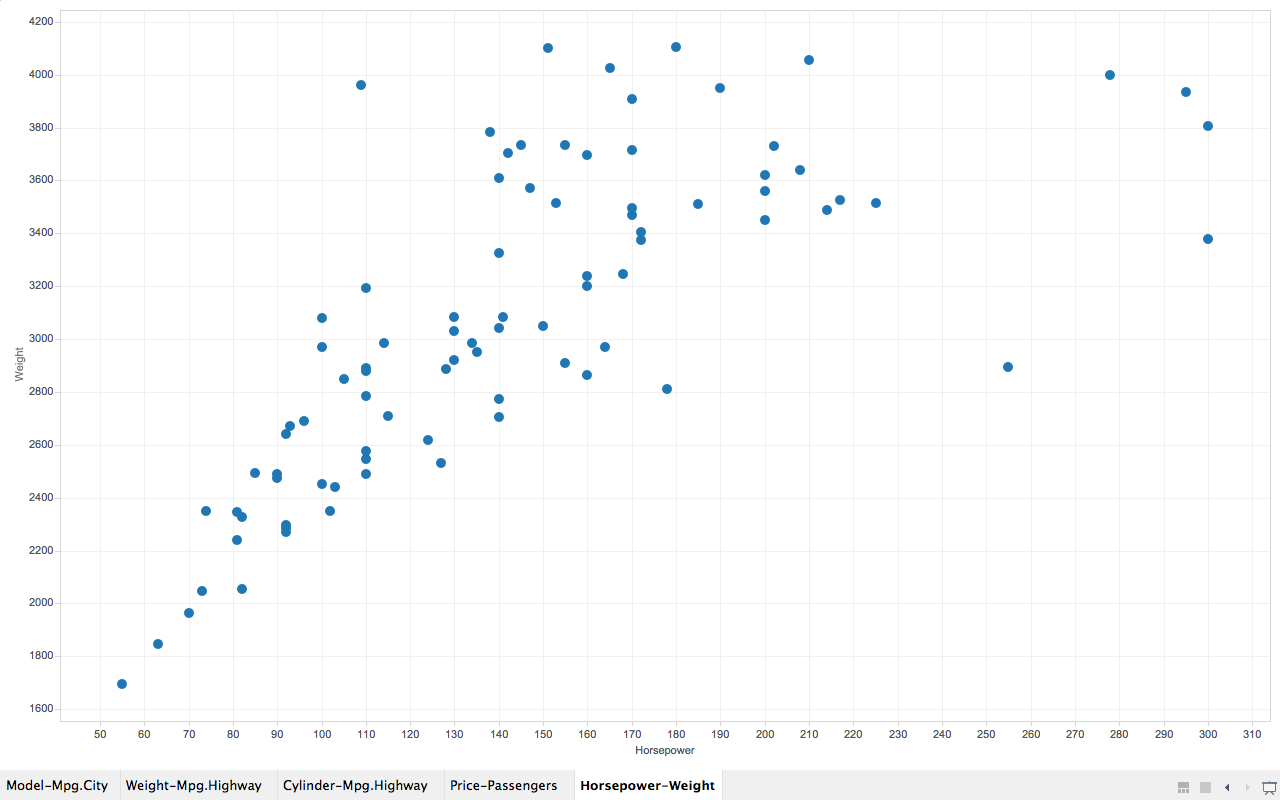
Answer:
Higher the horsepower, heavier the car.
How:
Drag-and-drop. Then select dimension instead of measure from the dropdown.
Name any other interesting correlations that you find through interacting with the data.
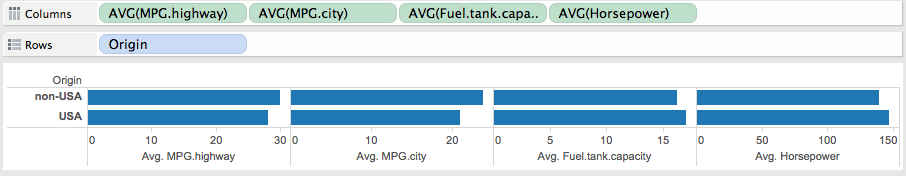
Answer:
I tried to explore different attributes according to cars origin. And interestingly, I was able to recognize a pattern that USA manufactured cars burn more oil, have bigger fuel tank and have higher horsepower than non-USA manufactured cars. Guess USA people are more dynamic than other countries huh?
How:
Drag-and-drop, then select average for all the measures in column.