Data visualization is all about using visual channels to convey information to the user (reader.). In this chapter the author is mainly focused on the “Marks and Channels” which are very good tools to analyze visual encodings.
After a quick scan through the chapter, I realized that the chapter can be roughtly divided into two parts: Definition and Utilization.
The first part describes the definition of marks and channels.
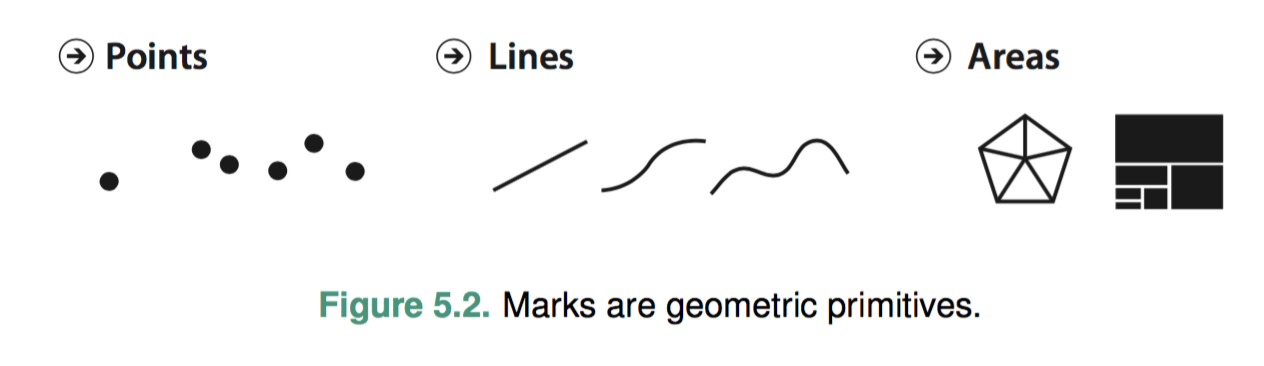
A proper way to categorize marks is the number of dimensions, shown in the picture below.
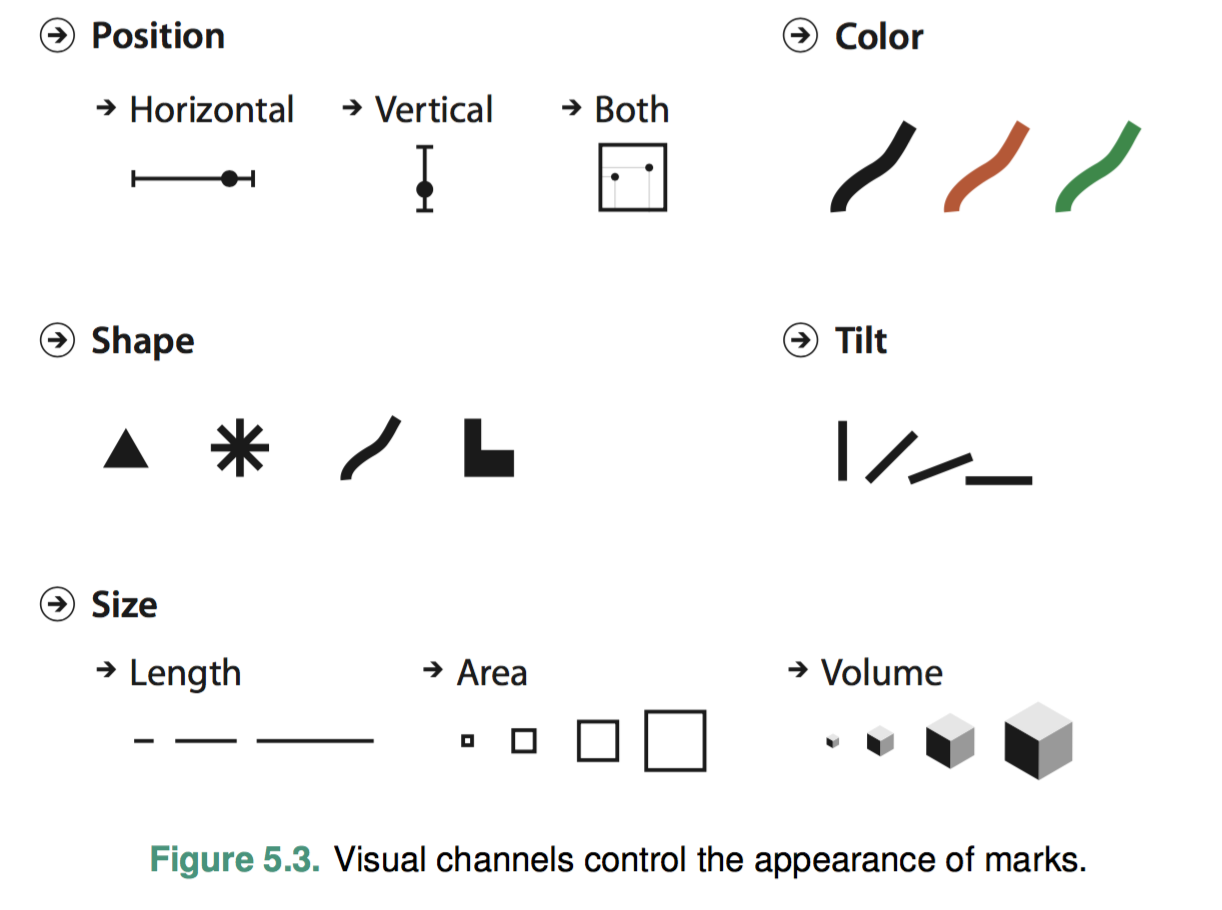
Versatile as the visual channel, it is basically the organization of marks in different forms. And usually we use the composite of different visual channels.
In the second part, the author is trying to express the pros and cons in using visual channels in visual encoding. And she focused mostly on the effectiveness of different channels.
She also gives a ranking for effectiveness and expressiveness of different visual channels.
Under the hood, I think the limitation of different visual channels is mainly affected by human perceptions, and the result or conclusions described in the chapter should be years of research experience.
Conclusion is, we should be careful when we are designing or implementing our own visualizations in terms of visual encodings.
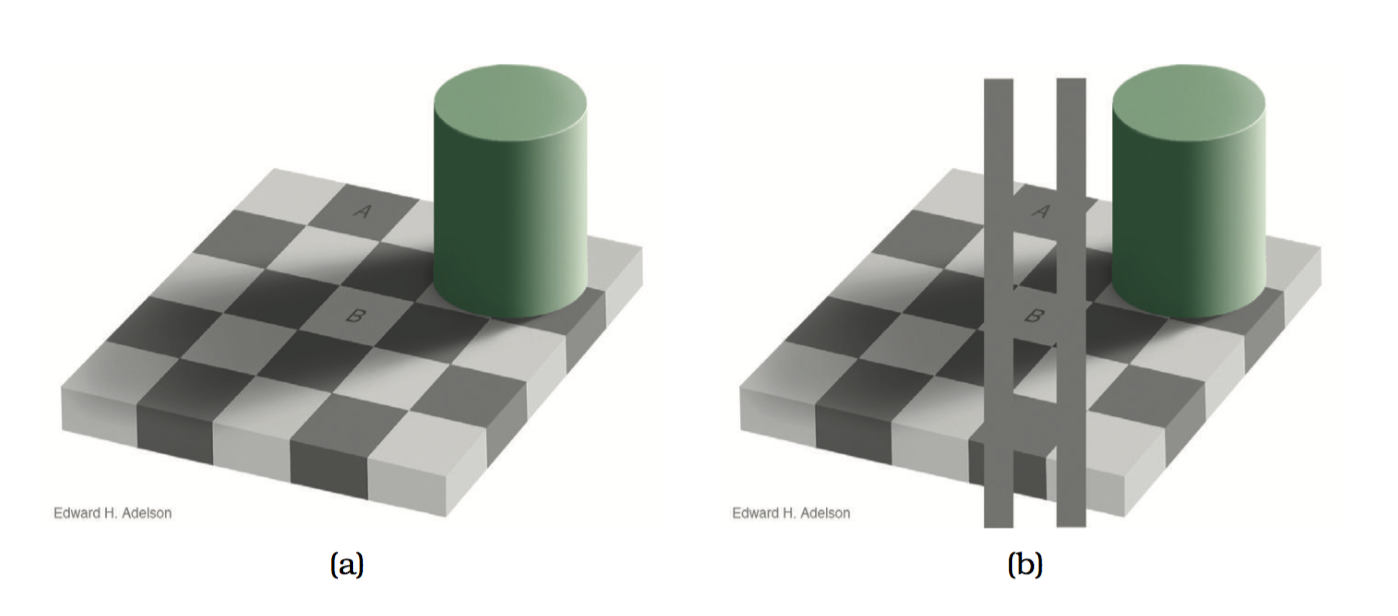
Knock knock, I will end this blog with one of my favorite picture to emphasize that human perceptions can sometimes lead to illusions;)