Time flew by, now is the beginning of the 3rd week of my last semester. There are so many things I want to build while so little time left before starting the mundane life as a “coding monkey” (Chinese word for software practitioners since in Chinese the word for programmer sounds like the monkey who writes code. Kind of like nerd used in English.). During the past two weeks I was coding day and night without too much time reading blogs or surfing online. While today when I finally opened up my Pinterest board, there is this cool data vis came into my sight. And the name for it is “Strength of Nations”.
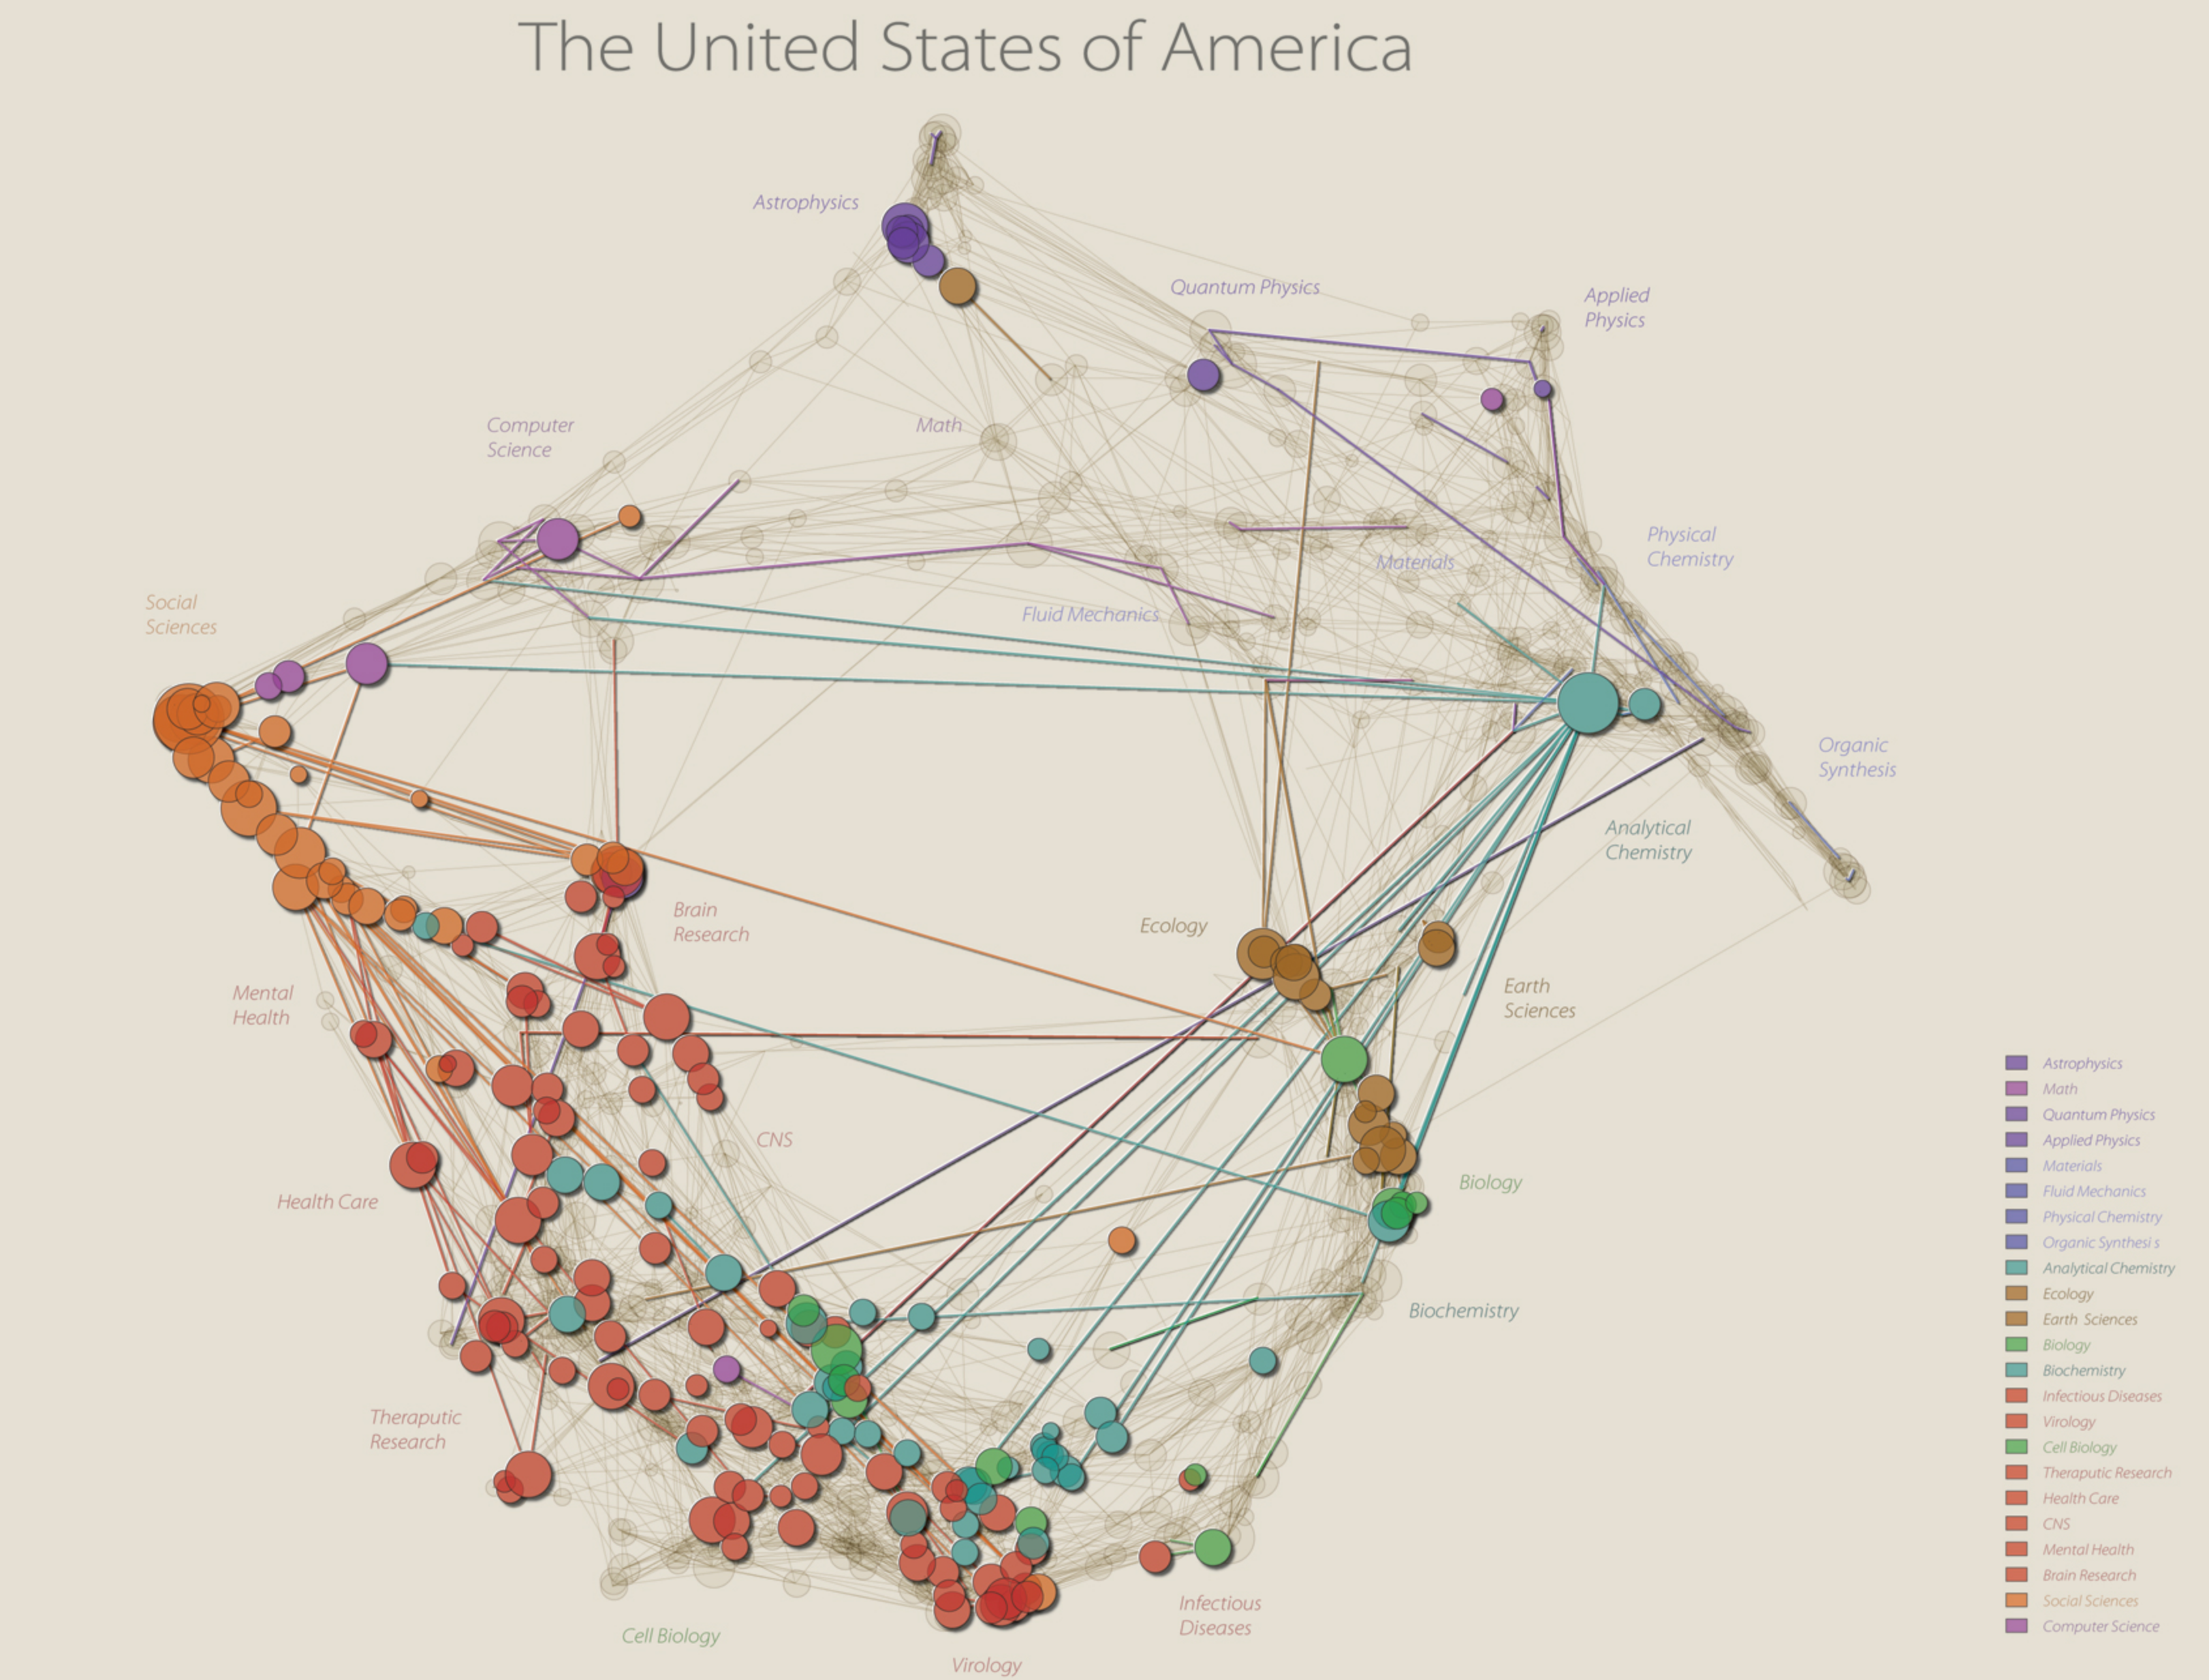
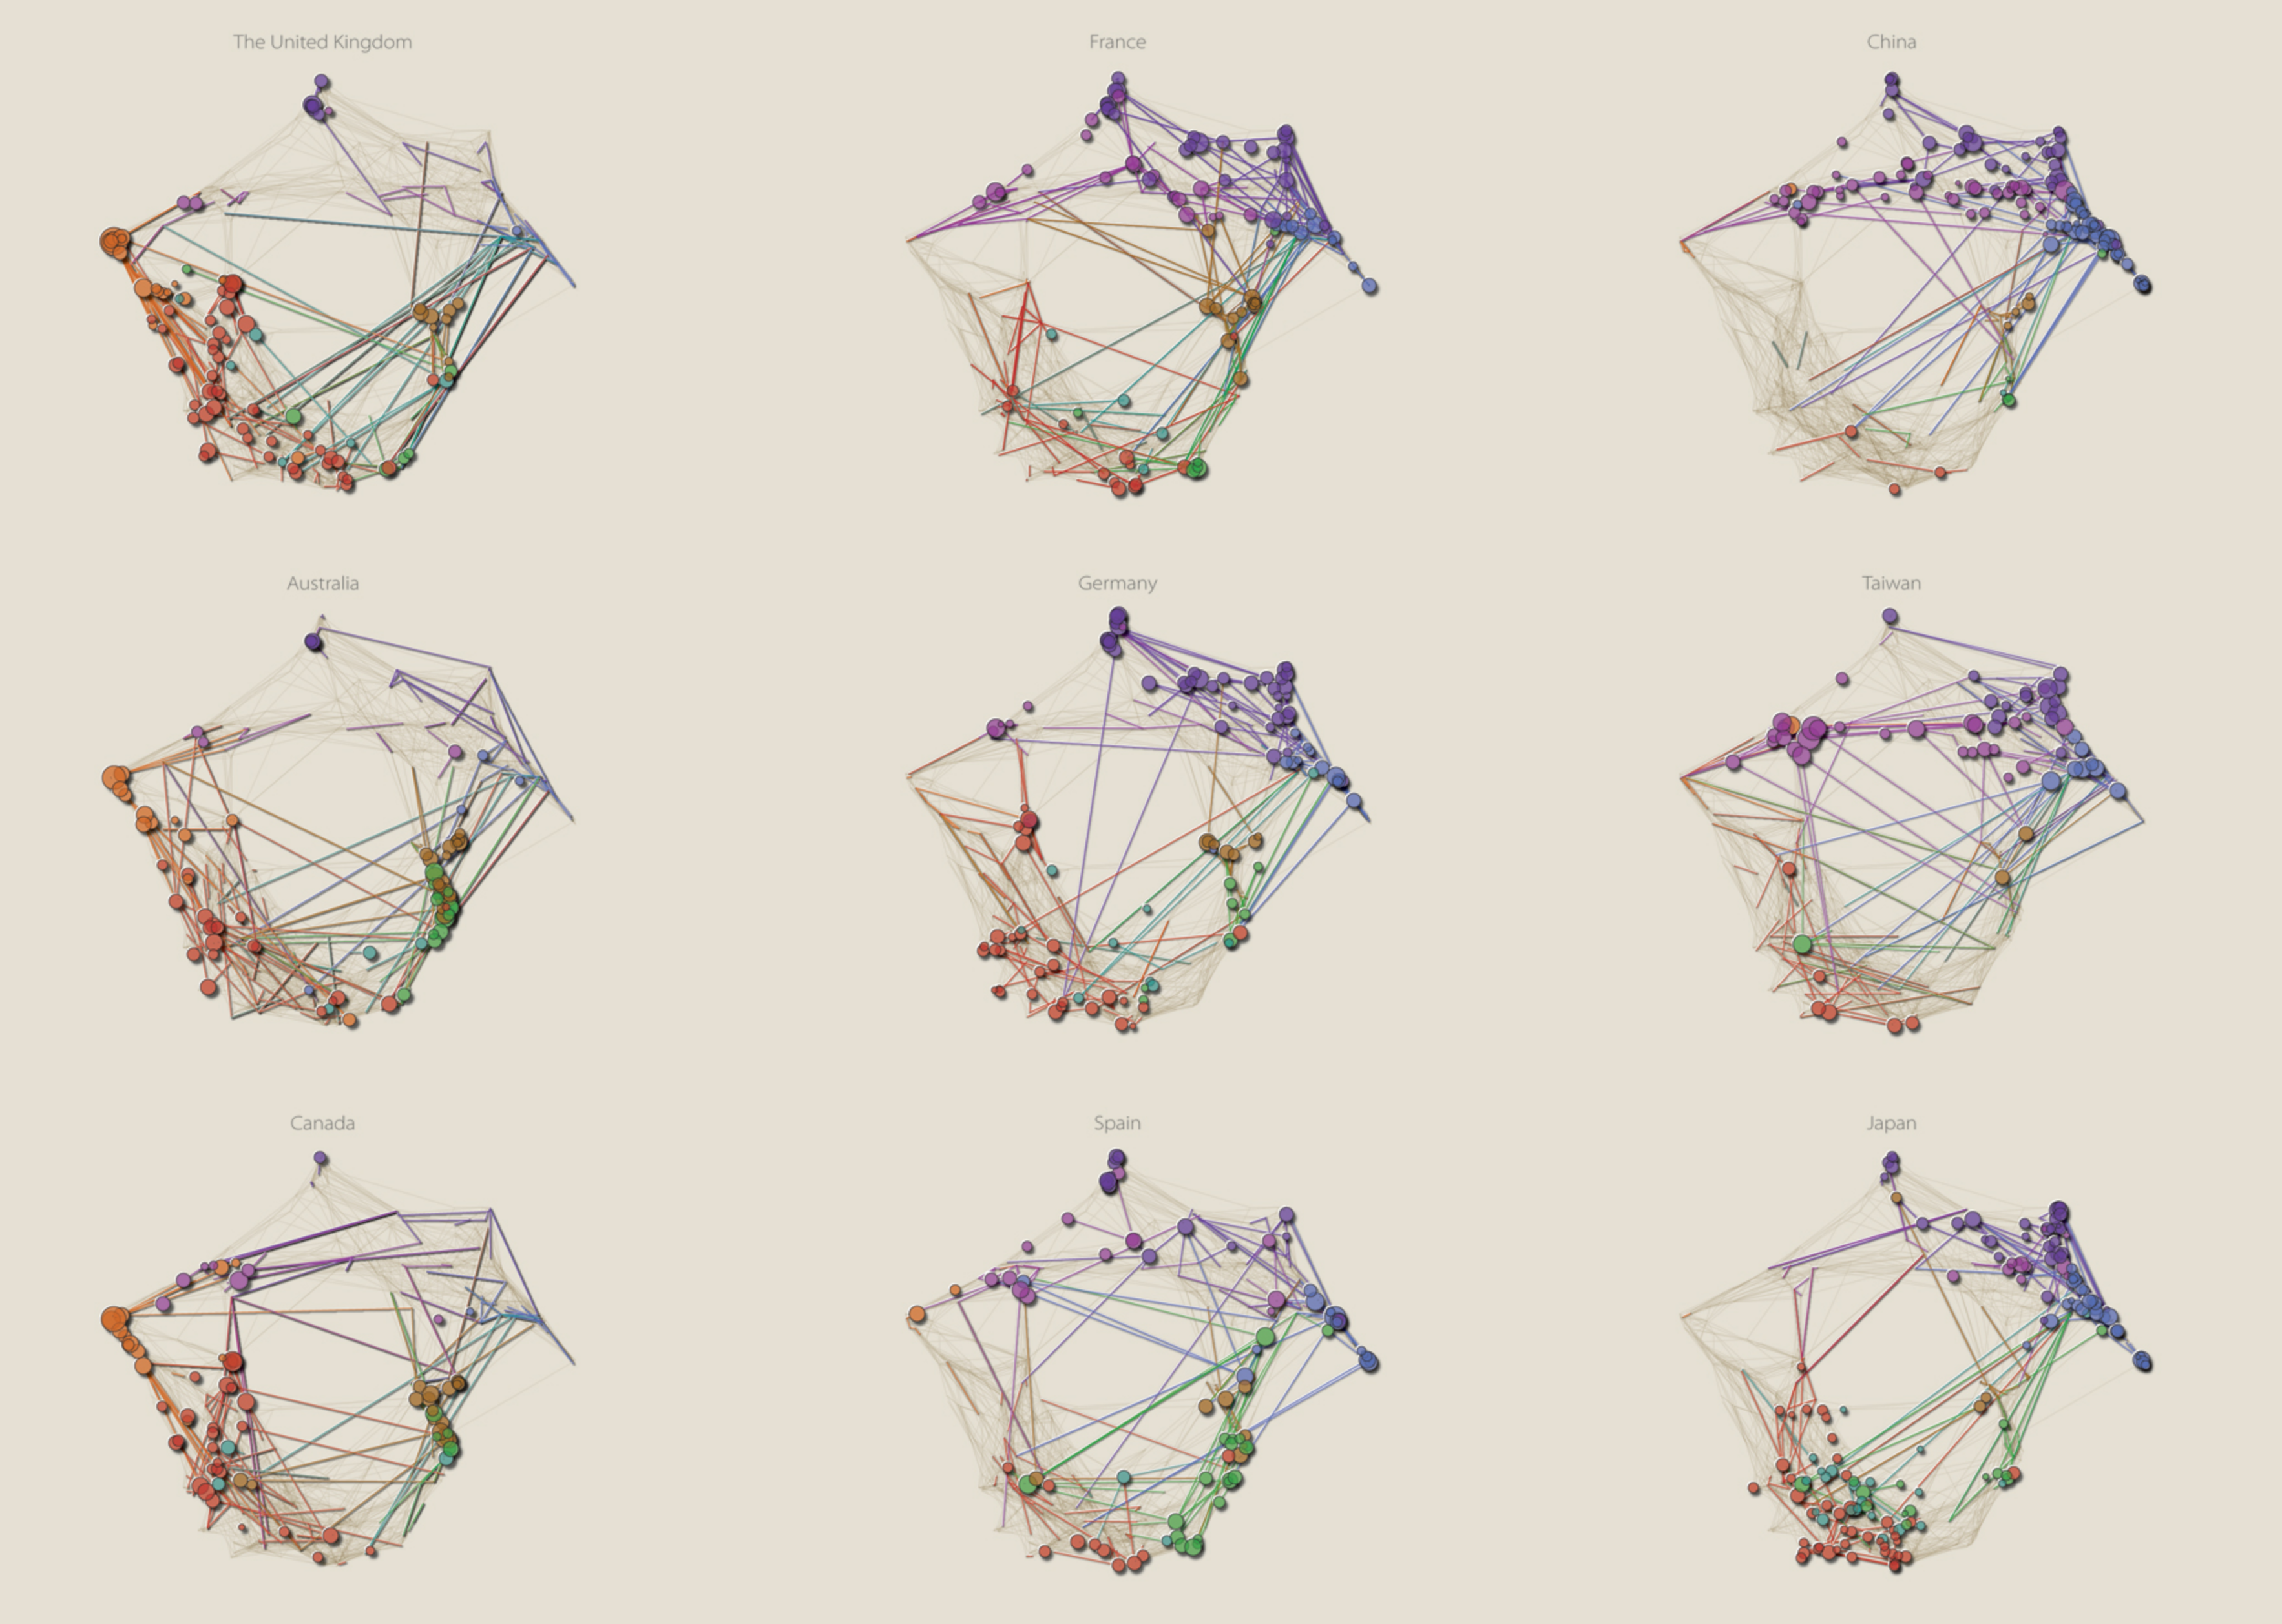
The reason it caught my eye first is that it looks good. The combination of the colors used on the parchment forms a kind of harmony. Another example of a similar color usage is here. But some further reading revealed that this is actually a pretty decent vis in technical aspects. As we can see each node represents scientific publications in a particular topic, while the links shows publications that explore more than one topic or interdisciplinary researches. This vis tool not only makes it very easy to locate and query a single topic but also gives a clear emphasis on the relationships between different disciplines. For the screenshot we know immediately United States has a significant numbers of papers in the social sciences and medical sciences and also has strong interdisciplinary researches pertain to Biochemistry. And from the screenshot below showing the comparison of countries, we can acquire the likelihood of emphasis on different areas of research and by the first look we know that China and Taiwan have very similar research focuses.
