Retrospect on Hans Rosling: The best stats you’ve ever seen
I feel really lucky that I had the chance to watch this talk. Before that I never got Data Visualization.
Why is every body talking about it or how come people create a new discipline for something that’s really depending on intuition.
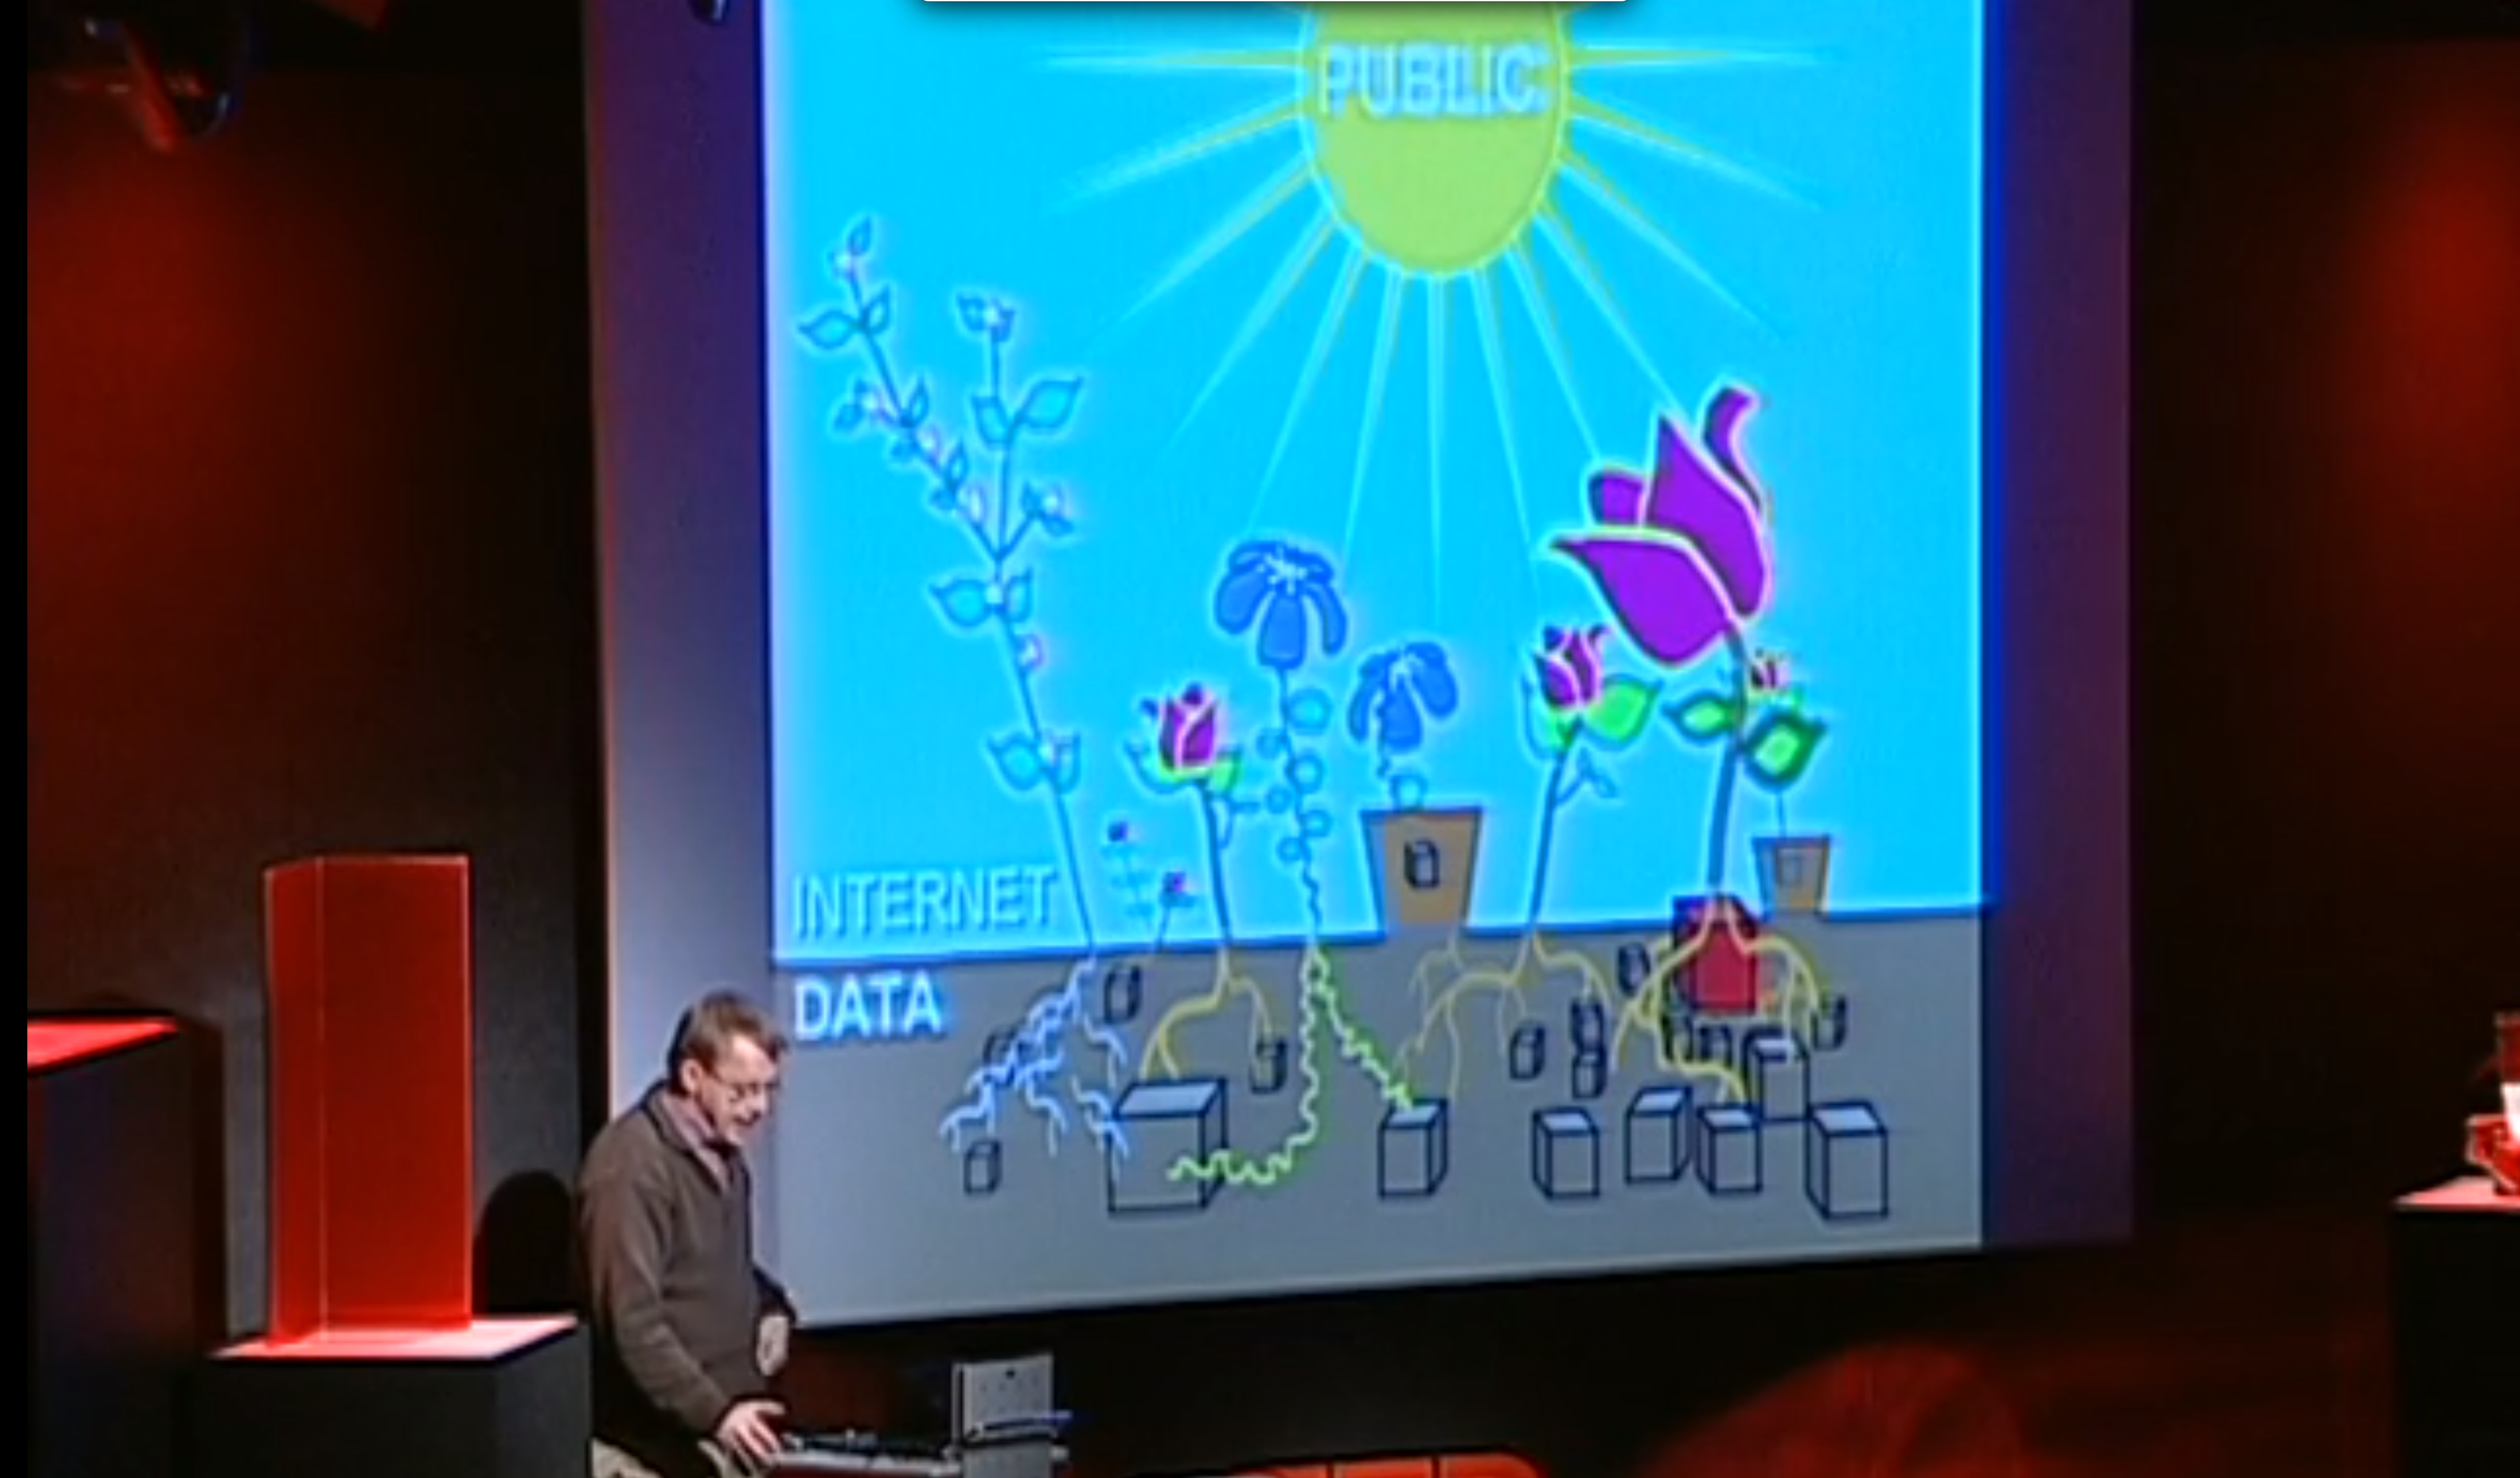
In this talk, Hans Rosling was like a wizard, whose magic is to manipulate visual elements to convey critical information or trends to his audience. I did’t get to it until I saw the pictures that all the lovely flowers grew on the soil with raw data embedded in it. But data is Hans Roling’s mojo (of course with his knowledge and experience in this field.).

What if you discovered oil before you invented the internal combustion engine?
The realization of that the data is the raw material which could be exploited and be used in some greater course, is no less than the invention of the combustion engine as inferred from Oscar Isaac‘s remark in Ex Machina.
Given that analogy, learning Data Visualization is more like learning technologies that build more efficient and more powerful engines. And for us computer science students or researchers, our duty is to practice and invent better tools that can help people build data visualization apps either used for a specific requirement or serve as a general framework that people use in a kind of situations.
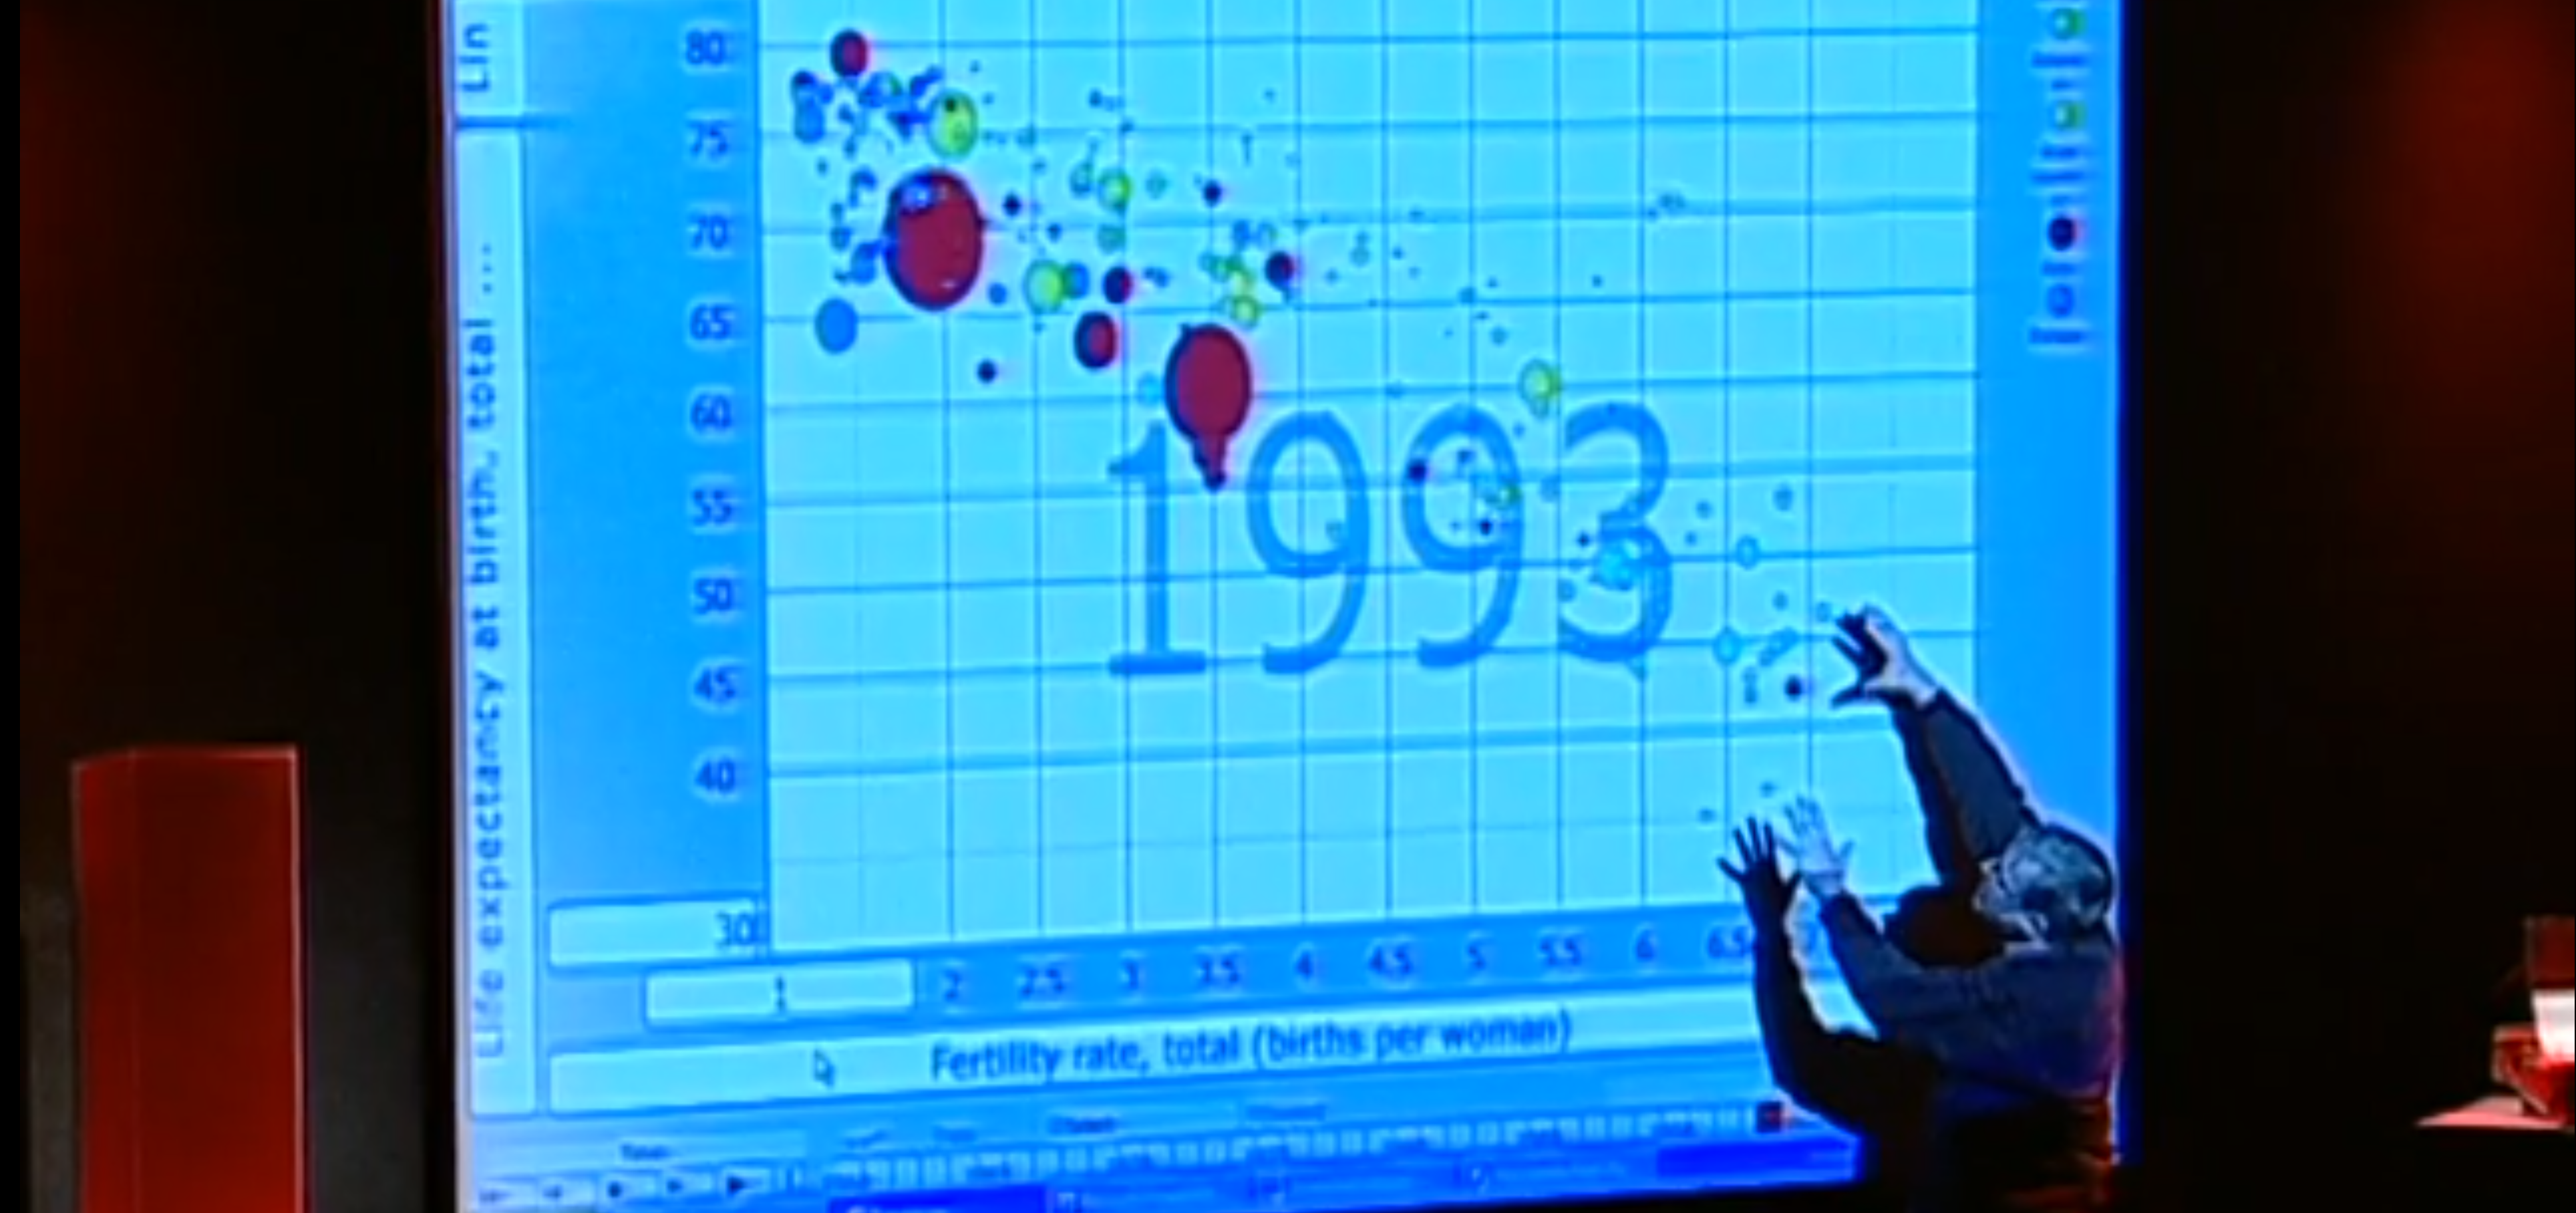
At the end, please allow me to use another screenshot from Hans Roslings talk to remind me what we can do, and what we can achieve in the future.